Setting The Foundation For Reports That Matter

Many SEO reports go unread, never truly influencing strategy. How can we transform these data dumps into dynamic tools that drive real decision-making? The key is understanding that SEO reports shouldn't just exist; they should actively contribute to business goals. This means shifting the focus from simply presenting data to showcasing the impact of SEO efforts on the bottom line.
Building impactful reports requires a strategic approach. Start by understanding your audience and their priorities. What language resonates with them? Executives, for example, might not understand keyword density, but they understand revenue growth. Framing your SEO successes in terms of their business objectives, like increased leads or boosted brand visibility, is crucial.
Effective SEO reporting also requires understanding the importance of search engines. As of 2025, 68% of online experiences begin with a search engine, highlighting SEO's critical role in capturing initial user interactions. 53.3% of all website traffic comes from organic search, further emphasizing the need for accurate reporting to measure and optimize these efforts. More detailed statistics can be found here: https://intergrowth.com/seo/stats/
Framing Your Data For Maximum Impact
The way you present data significantly influences its impact. Think of your report as a story, not just a spreadsheet. Use clear, concise language, avoiding technical jargon. Visualizations like charts and graphs can make complex data more digestible. Context is also essential. For example, instead of reporting a 10% increase in organic traffic, explain why it happened and what it means for the business. Did a new content strategy succeed? Did improved rankings drive more qualified leads?
Here are key elements for structuring your reports:
- Executive Summary: A brief overview of key findings and their business implications allows stakeholders to quickly grasp the main points.
- Key Metrics: Focus on metrics directly aligned with business objectives, such as organic traffic, conversion rates, and keyword rankings for relevant terms.
- Data Visualization: Use charts and graphs to present data clearly and compellingly, making complex information easier to understand.
- Actionable Insights: Don’t just report the data—analyze it. Identify trends, highlight opportunities, and recommend concrete next steps.
By focusing on these elements, you can transform SEO reports into powerful tools that drive business growth and demonstrate the true value of your SEO work. Treat your reports as strategic narratives, ensuring your data is not just seen, but understood and acted upon.
Choosing Metrics That Tell A Real Story
Stop drowning stakeholders in vanity metrics that impress but don't inspire action. This section reveals which metrics truly correlate with business growth and how to present them to spark meaningful discussions. By analyzing high-performing SEO programs, we’ll uncover the crucial indicators that distinguish successful campaigns from the rest.
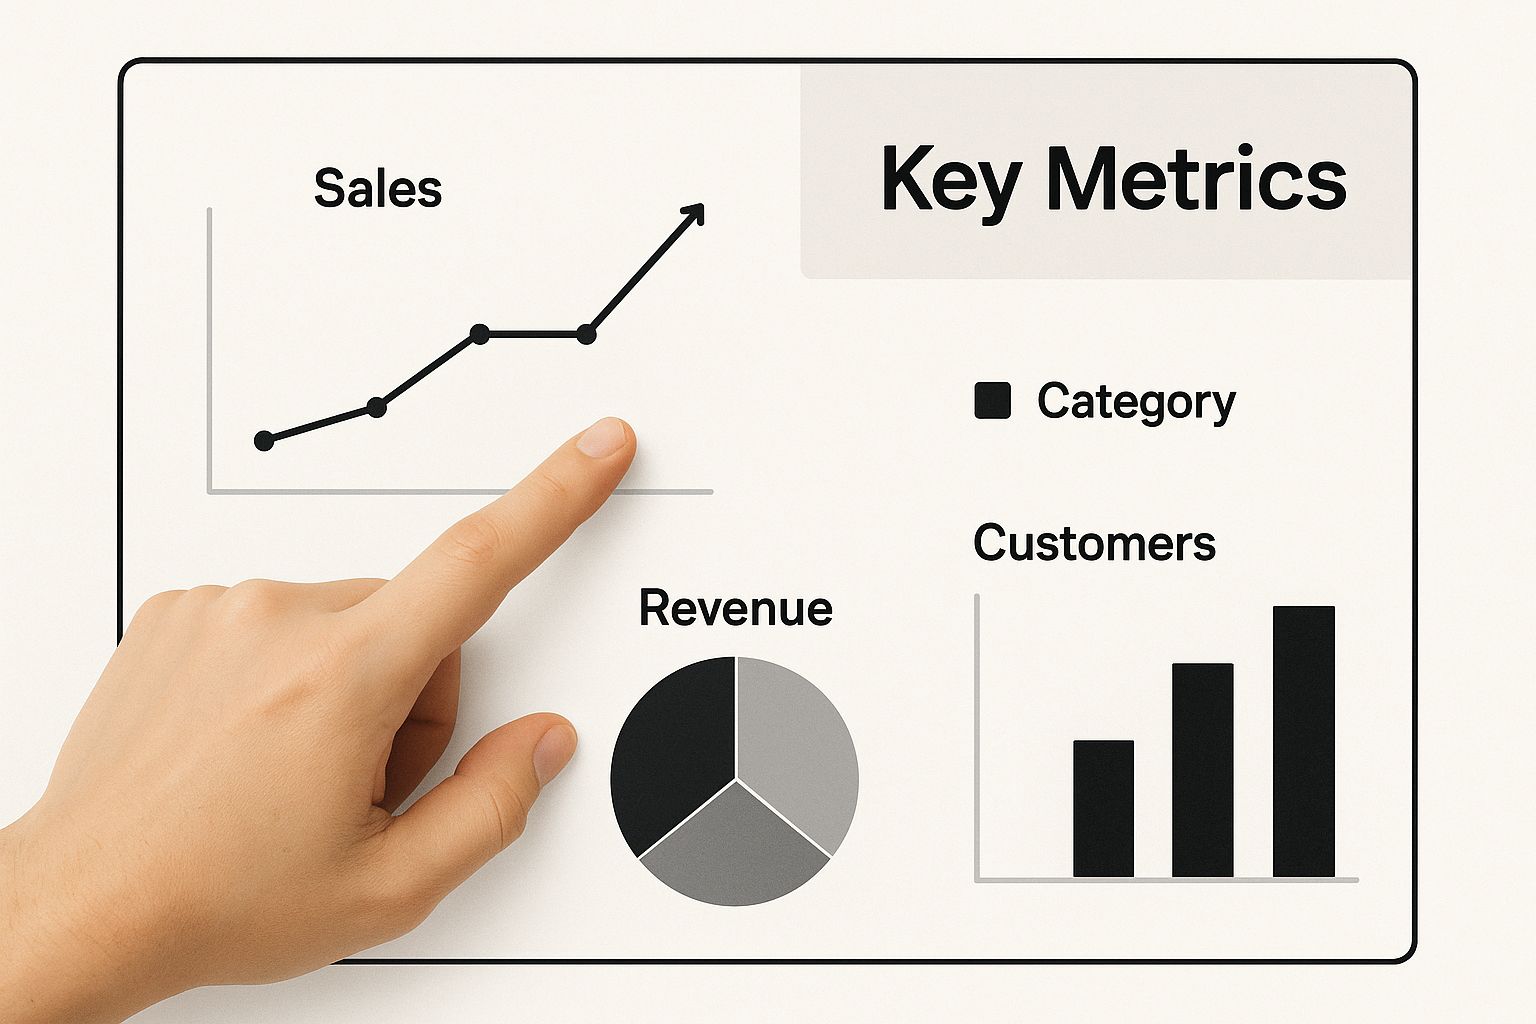
The infographic above shows analytic dashboards highlighting key metrics. These dashboards provide a centralized view of crucial data points, allowing SEO professionals to quickly assess performance. The visual representation, combined with a person actively analyzing the information, emphasizes the importance of understanding these metrics to guide strategic decisions.
This means focusing on the right data is essential. You’ll learn to build metric hierarchies that guide decision-making, discover frameworks for linking SEO performance to revenue, and explain complex relationships simply. For example, choosing the right metrics is crucial when creating SEO reports. Understanding key performance indicators is similar to effective marketing campaign tracking.
Avoiding Common Reporting Pitfalls
We’ll also dissect common reporting errors that erode credibility and offer proven methods to build trust through transparent, actionable presentations. One common mistake is neglecting backlink health.
Robust SEO reports must include key metrics like keyword rankings, backlink health, and content performance for a comprehensive view of visibility and engagement. Over 66% of backlinks are broken, significantly impacting site rankings—a factor reports should address. Learn more about SEO statistics here.
Another critical error is fixating solely on traffic without considering conversions. A surge in visitors means little if it doesn't translate to leads or sales. Focusing on the conversion rate—the percentage of visitors who complete a desired action—reveals the effectiveness of driving business outcomes.
Building Reports That Drive Action
SEO reports shouldn’t just document the past; they should inform the future. This means incorporating forecasting and trend analysis. You might be interested in: How to Calculate SEO ROI.
By identifying emerging patterns, you can anticipate challenges and opportunities. This proactive approach empowers stakeholders to make informed decisions and allocate resources strategically.
Presenting SEO results clearly and compellingly is crucial. Tables, charts, and graphs can transform raw data into digestible insights. Framing SEO achievements within the context of broader business goals ensures stakeholders understand the value of your work.
To help illustrate the importance of various SEO metrics, let's take a look at the table below:
Essential SEO Metrics Comparison
A comprehensive comparison of key SEO metrics, their importance levels, and recommended reporting frequencies
| Metric Type | Business Impact | Reporting Frequency | Stakeholder Relevance |
|---|---|---|---|
| Keyword Rankings | Influences organic visibility and traffic | Weekly/Monthly | Marketing, Content, Management |
| Backlink Health | Impacts domain authority and ranking stability | Monthly/Quarterly | SEO, Management |
| Conversion Rate | Directly reflects business outcomes (leads, sales) | Weekly/Monthly | Sales, Marketing, Management |
| Traffic Volume | Indicates reach and potential audience engagement | Weekly/Monthly | Marketing, Management |
| Content Performance | Measures engagement and relevance of content strategy | Monthly/Quarterly | Content, Marketing, SEO |
This table summarizes the importance of selecting the right SEO metrics and aligning them with business objectives. Each metric offers unique insights, contributing to a holistic understanding of SEO performance and its impact on overall business growth.
Ultimately, the goal of SEO reporting is to drive action. By focusing on metrics that tell a compelling story, you can transform your reports from passive documents into catalysts for business growth.
Using Benchmarks To Provide Meaningful Context
Numbers alone in SEO reports can be misleading. Is a 5% increase in organic traffic good? It depends. This section explains how to incorporate industry benchmarks and competitive analysis to turn raw data into actionable strategic insights. This transforms your reports from simple data dumps into valuable tools stakeholders can actually use.

Why Benchmarks Matter
Benchmarks provide crucial context. Imagine a basketball player scoring 20 points. Impressive? Maybe. But if the league average is 30 points, the perspective changes.
Similarly, understanding the average conversion rate for your industry helps you understand whether your conversion rate is exceeding expectations or needs improvement. Knowing where you stand relative to others is key to strategic decision-making.
Gathering Benchmark Data
Several resources help establish benchmarks. Industry reports often provide average metrics for specific sectors. That's Rank! offers competitor analysis features, allowing you to see how you stack up against rivals. You might also find value in articles like How to Master SEO Performance Metrics.
Tracking relevant social media engagement metrics can reveal how your social presence contributes to your overall business goals. It's crucial to select metrics that connect engagement with tangible outcomes.
Presenting Competitive Positioning
Presenting competitive positioning effectively involves showcasing both opportunities and challenges. Highlight where you outperform competitors.
Also, identify areas for improvement. For example, if your organic traffic is lower than the industry average, explain the contributing factors and outline strategies to close the gap. This proactive approach demonstrates a solutions-oriented mindset.
Setting Realistic Expectations
SEO is a long-term game. The SEO industry is projected to reach nearly $107 billion by 2025, demonstrating significant global investment in search engine optimization. WordStream provides more detailed SEO statistics that illustrate this growth.
Furthermore, with 75% of users never venturing past the first page of search results, the importance of high rankings is undeniable. Positive ROI in SEO campaigns typically takes 6-12 months, with peak results appearing in later years.
This necessitates managing stakeholder expectations. While ambition is vital, setting realistic timelines and benchmarks fosters trust and prevents disappointment. Emphasize the potential for substantial long-term returns. Combining data with context and clear communication transforms SEO reports into powerful tools that drive informed decision-making and contribute to sustained success.
Advanced Techniques For Strategic Impact
Building on the basics of SEO reporting, this section explores advanced strategies to maximize the effectiveness of your SEO campaigns. By integrating sophisticated analysis, you move beyond simply presenting data and begin offering actionable insights that drive strategic decision-making. This elevates you from a reporter to a strategic advisor, directly influencing business objectives and contributing to overall success.
Advanced Segmentation Techniques
Segmentation involves dividing your data into smaller, more manageable groups to reveal hidden patterns. For example, segmenting organic traffic by device type (mobile vs. desktop) offers valuable insights into user behavior and pinpoints areas for improvement.
This granular analysis can inform content optimization strategies and enhance user experience on different devices. Segmenting by geographic location or user demographics further reveals optimization possibilities and opportunities to personalize content for specific target audiences.
Tracking Emerging SEO Trends
The SEO world is constantly changing. Staying informed about emerging trends is crucial for maintaining a competitive advantage. Your SEO reports should include analysis of these developing trends and their potential impact on performance.
This includes monitoring the influence of Generative AI on content creation and search results. It also means understanding the implications of zero-click searches, where users find information directly on the search engine results page (SERP) without clicking through to a website.
Further, understanding the rising importance of long-form content is essential. 94% of all clicks originate from organic search results, highlighting the importance of strong SEO practices. Content exceeding 3,000 words typically outperforms shorter content, generating 3x more traffic and 4x more shares. Explore more detailed statistics here. These trends require ongoing monitoring and strategic adaptation within your reports.
Content Performance Analysis
Connecting SEO work to tangible business outcomes is vital for demonstrating value. Integrate content performance analysis into your reports, linking SEO activities to engagement and conversion metrics.
Track metrics such as time on page, bounce rate, and conversion rate to illustrate how SEO drives valuable user interactions and contributes to business goals. This data-driven approach provides concrete evidence of SEO's effect on the bottom line, justifying continued investment and establishing SEO as a core driver of growth.
Forecasting and Identifying Opportunities
Advanced SEO reports should not only report on past performance but also anticipate future trends and identify untapped opportunities. Use historical data, trend analysis, and competitive benchmarking to forecast future SEO performance.
This proactive approach allows for strategic resource allocation and maximizes growth potential. Identifying areas where competitors are outperforming your site can reveal valuable information and inform future SEO strategies. Tools like the That's Rank Competitor Analysis feature can help with this process and provide data-driven recommendations.
Layering Insights for Compelling Narratives
Effective SEO reporting involves crafting a compelling narrative around your data. This means layering insights to create a cohesive story that resonates with stakeholders. Connect individual data points to broader trends and business objectives, clearly illustrating SEO's impact.
This approach transforms raw data into actionable strategies, driving strategic decisions and strengthening your position as a strategic partner. Using visualization tools from platforms like That's Rank! further enhances the clarity and impact of your SEO reports, ensuring they are not just viewed but understood and acted upon.
Design and Visualization That Actually Communicates
Even the most insightful SEO data is worthless if it's hidden in a poorly designed report. This section focuses on transforming data into a visually compelling and easily digestible story for busy executives. Just like a gourmet meal requires thoughtful presentation, your data needs the right visuals to be truly appreciated.
Choosing the Right Chart Type
Selecting the right chart type is crucial for clear communication. Line graphs effectively illustrate trends in organic traffic over time. Bar charts compare keyword rankings across competitors. Pie charts highlight the distribution of traffic sources. Tables present detailed data in an organized way. That's Rank! provides customizable dashboards, allowing you to select the most effective visualization for every metric, ensuring a clear and concise data story.
Color Psychology and Visual Hierarchy
Strategic color use enhances the professional impact of your SEO reports. Using your brand colors reinforces brand identity and creates a cohesive experience. Contrasting colors highlight key data points and draw attention to important trends. A clear visual hierarchy, using headings, subheadings, and bullet points, guides the reader and makes the report easily scannable. That's Rank!'s reporting features let you tailor the visual aspects to resonate with your audience and communicate findings effectively.
Tools and Templates for Streamlined Creation
Creating high-quality SEO reports doesn't have to be time-consuming. Using tools and templates streamlines creation while maintaining quality. That's Rank! offers customizable templates for various needs, from monthly performance summaries to in-depth technical SEO audits. These templates provide a solid foundation, so you can focus on customizing the content, not starting from scratch. This efficient approach delivers professional, insightful reports without sacrificing valuable time.
Balancing Detail and Scannability
A good SEO report balances detailed analysis with easy scannability for busy executives. Like a newspaper, headlines grab attention, while the article provides the full story. Your SEO report should use headings and visual cues to highlight key takeaways, allowing stakeholders to quickly grasp the main points. Including detailed data tables and supporting information allows for deeper dives when needed. This approach caters to different engagement levels, providing both high-level overviews and granular detail.
Learn more about SEO reporting at That's Rank! and see how its features can transform your data into compelling narratives that drive action. An effective SEO report isn't just about showing data; it's about telling a story that drives meaningful business decisions.
Streamlining Creation With Smart Automation
Manual SEO report creation is a time-consuming process. It’s also prone to errors, impacting both productivity and credibility. This means that automation is no longer a luxury, but a necessity for modern SEO professionals. This section explores the automation landscape and reveals how you can transform your reporting efficiency. We’ll also show you how to retain the valuable customization that makes your reports unique and impactful.
Evaluating Automation Platforms
Several platforms offer varying levels of automation for SEO reporting. Choosing the right one depends on your specific needs and resources. For instance, That’s Rank! provides robust automation features. These include automated alerts for ranking changes and customizable data exports. For more practical tips, check out our guide on How to Create an SEO Client Dashboard. It offers valuable strategies on effective reporting and client management.
Other platforms offer similar capabilities, often with additional features. Semrush and SE Ranking include options like competitor analysis and backlink monitoring. Comparing these platforms is crucial for making informed decisions. You should consider real-world usage, integration capabilities, and pricing tiers.
To help illustrate the key differences, the table below offers a side-by-side comparison of these popular SEO reporting tools. It details their features, pricing, and ideal use cases.
SEO Reporting Tools Comparison
| Tool Name | Key Features | Pricing Tier | Best For | Integration Options |
|---|---|---|---|---|
| That's Rank! | Automated alerts, custom data exports | Free & Paid | Businesses, agencies, and in-house teams | Varies |
| Semrush | Competitor analysis, backlink monitoring | Paid | Agencies and larger businesses | Extensive |
| SE Ranking | Keyword tracking, website auditing | Paid | Agencies and businesses of all sizes | Varies |
This comparison highlights the strengths of each platform, empowering you to select the ideal tool for your reporting needs.
Building Automated Workflows
Automating data collection is the first step toward efficient reporting. Connect your analytics platforms directly to your reporting tool. Examples include Google Analytics and Google Search Console. This eliminates manual data entry, reducing errors and saving valuable time.
Setting up dynamic reports that update automatically is also beneficial. This ensures stakeholders always access the latest data without manual intervention. Regularly review and adjust these automated processes. This maintains data accuracy and ensures alignment with evolving SEO goals.
Maintaining Accuracy and Handling Challenges
While automation streamlines reporting, quality control checks are essential. Regularly compare automated data with manual checks. This helps catch discrepancies and ensure accuracy, maintaining the credibility of your reports.
Anticipating common automation challenges is also important. Data integration issues can arise, so establish clear troubleshooting processes. Having fallback procedures is essential to avoid reporting disruptions. You might also encounter limitations with certain automation features. This may require a combination of automated and manual efforts. Flexibility and adaptability are key to successful long-term automation.
Key Takeaways
Creating effective SEO reports that truly inform business decisions requires a shift in perspective. Instead of simply presenting data, your focus should be on showcasing the impact of SEO on tangible business objectives. This involves understanding your stakeholders, utilizing relevant metrics, and crafting a compelling narrative.
Focus on Actionable Metrics
While metrics like website traffic offer a glimpse into website performance, they don't tell the whole story. Concentrate on actionable metrics that directly correlate with your specific business goals. These could include conversion rate, keyword rankings for relevant terms, and backlink health. For example, if conversions are your primary objective, a 10% increase in conversions holds significantly more weight than a 10% increase in traffic.
Considering that over 66% of backlinks are broken, which negatively impacts search engine rankings, regular backlink audits are not just recommended, they are essential. Your SEO reports should clearly demonstrate how improvements in these key areas contribute to the overall business strategy.
The Importance of Context
Raw numbers without context lack meaning. To provide perspective and make your data truly insightful, incorporate industry benchmarks and competitive analysis into your reports. Knowing the average conversion rate for your industry, for example, helps determine whether your performance is above average or needs improvement. Similarly, understanding your keyword rankings relative to your competitors highlights opportunities and areas where you can outperform them. These benchmarks help justify investment in SEO and demonstrate its strategic value.
Visualizing Your Data
Even the most valuable insights can get lost in poorly designed reports. Use charts, graphs, and tables to present your data clearly and engagingly. Choose the right visualization method for the data you’re presenting: a line graph for trends, a bar chart for comparisons, or a pie chart to illustrate proportions. A well-designed SEO report transforms complex data into a digestible and easily understood narrative.
Automating Your Reports
Manual report creation is time-consuming, inefficient, and prone to errors. Automating data collection and reporting frees up valuable time for analysis and strategy development. Tools like That's Rank! offer customizable dashboards, automated alerts, and scheduled reporting, allowing you to focus on extracting insights, not tedious manual tasks. This automation also provides scalability, enabling detailed tracking across multiple domains and clients without sacrificing accuracy or efficiency.
Turning Data Into Action
The ultimate goal of SEO reporting is not just to present data, but to inspire action. Your reports should provide clear, concise recommendations based on your data analysis. If keyword rankings have dropped, suggest concrete steps to address the issue. If conversions are low, recommend A/B testing landing pages or optimizing calls to action. Empower stakeholders to make informed decisions that drive business growth. Transform your SEO reporting from a tedious chore into a powerful business asset. Start creating reports that matter with a free trial of That's Rank! today.