Knowing how to monitor your website traffic is fundamental. It's about using tools like Google Analytics to see how visitors interact with your site, where they come from, and what content really resonates. With this insight, you can make smarter decisions that improve their experience and help you hit your business goals.
Why Monitoring Traffic Is More Than a Numbers Game

Before we jump into the technical side of setting up analytics, it’s crucial to understand why this matters so much. Monitoring website traffic isn’t about just watching numbers tick up on a dashboard. It’s about learning to read the story your audience is telling you through their actions. Every metric is a piece of direct feedback from the real people visiting your site.
Think of your website as a physical store for a moment. You wouldn't just stand at the door counting how many people walk in. You’d want to know what they look at, what they end up buying, and which displays draw the most attention. Website traffic analytics gives you that same level of insight, just for your digital space.
Understanding the Language of Your Audience
Every single data point reveals something about human behavior. Seeing a high bounce rate on a critical landing page? That could be a red flag that your ad copy doesn't quite match what the page delivers. On the flip side, a long session duration on a blog post is a fantastic sign that your content is hitting the mark and genuinely helping your readers.
By keeping a close eye on your traffic, you start to find answers to the most important business questions:
- Who is actually visiting my site? You can uncover demographic and geographic details to sharpen your ideal customer profile.
- How did they find me? This helps you identify which channels—like organic search, social media, or paid campaigns—are your true workhorses.
- What content do they love? Pinpoint the pages and articles that get the most views and engagement, which tells you exactly what to create next.
- Where are the friction points? You can spot the pages where users are dropping off, signaling a potential problem with the user experience or site design that needs fixing.
To get started, you'll need to get familiar with a few key terms. This table breaks down the core metrics you'll see in most analytics platforms.
Core Website Traffic Metrics Explained
| Metric | What It Measures | Why It Matters for Growth |
|---|---|---|
| Users | The number of unique individuals who have visited your site within a specific timeframe. | Helps you understand the overall size and reach of your audience. |
| Sessions | A group of interactions a single user takes within a given time frame on your site. | Shows how frequently people are engaging with your site, beyond just one-time visits. |
| Pageviews | The total number of pages viewed. Repeated views of a single page are counted. | Indicates the overall volume of content being consumed on your site. |
| Bounce Rate | The percentage of single-page sessions in which there was no interaction with the page. | A high bounce rate can signal poor user experience or irrelevant content for that traffic source. |
| Session Duration | The average length of time users spend on your website during a single session. | Longer durations suggest your content is engaging and valuable to your visitors. |
| Traffic Source | The origin of your visitors, such as Organic Search, Social, Direct, or Referral. | Tells you which marketing channels are most effective at driving traffic to your site. |
Think of this table as your quick-reference guide. Understanding these metrics is the first step toward turning raw data into real strategy.
Moving From Data Collection to Strategic Action
Ultimately, the goal isn't just to hoard data; it's to use it to drive growth. Once you understand the behavior behind the numbers, you can take specific, effective actions. For example, if you see that 65% of your traffic comes from mobile devices but your mobile conversion rate is lagging, you know right away that optimizing the mobile checkout process should be a top priority.
The real power of monitoring website traffic lies in using the data to ask better questions. Instead of asking, "How many visitors did I get?" you start asking, "Why did visitors from this channel behave so differently than others?"
This shift in perspective is what separates passive observation from an active, growth-oriented strategy. It empowers you to invest your time and resources more effectively, focusing on initiatives that are proven to connect with your audience and deliver results. When you treat your analytics as a direct line of communication with your visitors, you pave the way for sustainable, meaningful growth. This guide will walk you through setting up the tools and, more importantly, how to interpret what they're telling you.
Building Your Essential Traffic Monitoring Toolkit
To really understand what’s happening with your website's traffic, you need the right tools in your corner. Let's start with the two free powerhouses from Google that are the bedrock of any serious analytics strategy: Google Analytics 4 (GA4) and Google Search Console (GSC). Getting these set up isn't just a technical box to check; it’s your first step toward gathering clean, reliable data you can actually trust.
Think of it this way: GA4 tells you everything that happens on your website. Who's visiting? How are they moving from page to page? What content are they actually spending time with? GSC, on the other hand, gives you the view from Google's perspective. It shows you how your site looks in search results—what queries people are using to find you and how often you're showing up. Together, they paint the full picture.
Getting Started with Google Analytics 4
First things first, you’ll need a Google Analytics account and a GA4 property for your website. This process gives you a unique tracking code—a small bit of JavaScript that you'll add to your site. This little snippet is what lets Google start collecting data on your visitors.
If you're new to this world, a good beginner's guide to website analytics can be a lifesaver. It’s worth taking a few minutes to grasp the core concepts before diving into the technical settings.
Actually installing the code is usually pretty simple. Most modern website platforms like WordPress or Shopify have a specific field where you just paste your GA4 Measurement ID. If you're doing it manually, the code snippet belongs in your site's HTML, right before the closing </body> tag.
This graphic breaks down the basic flow for getting your analytics online and working for you.
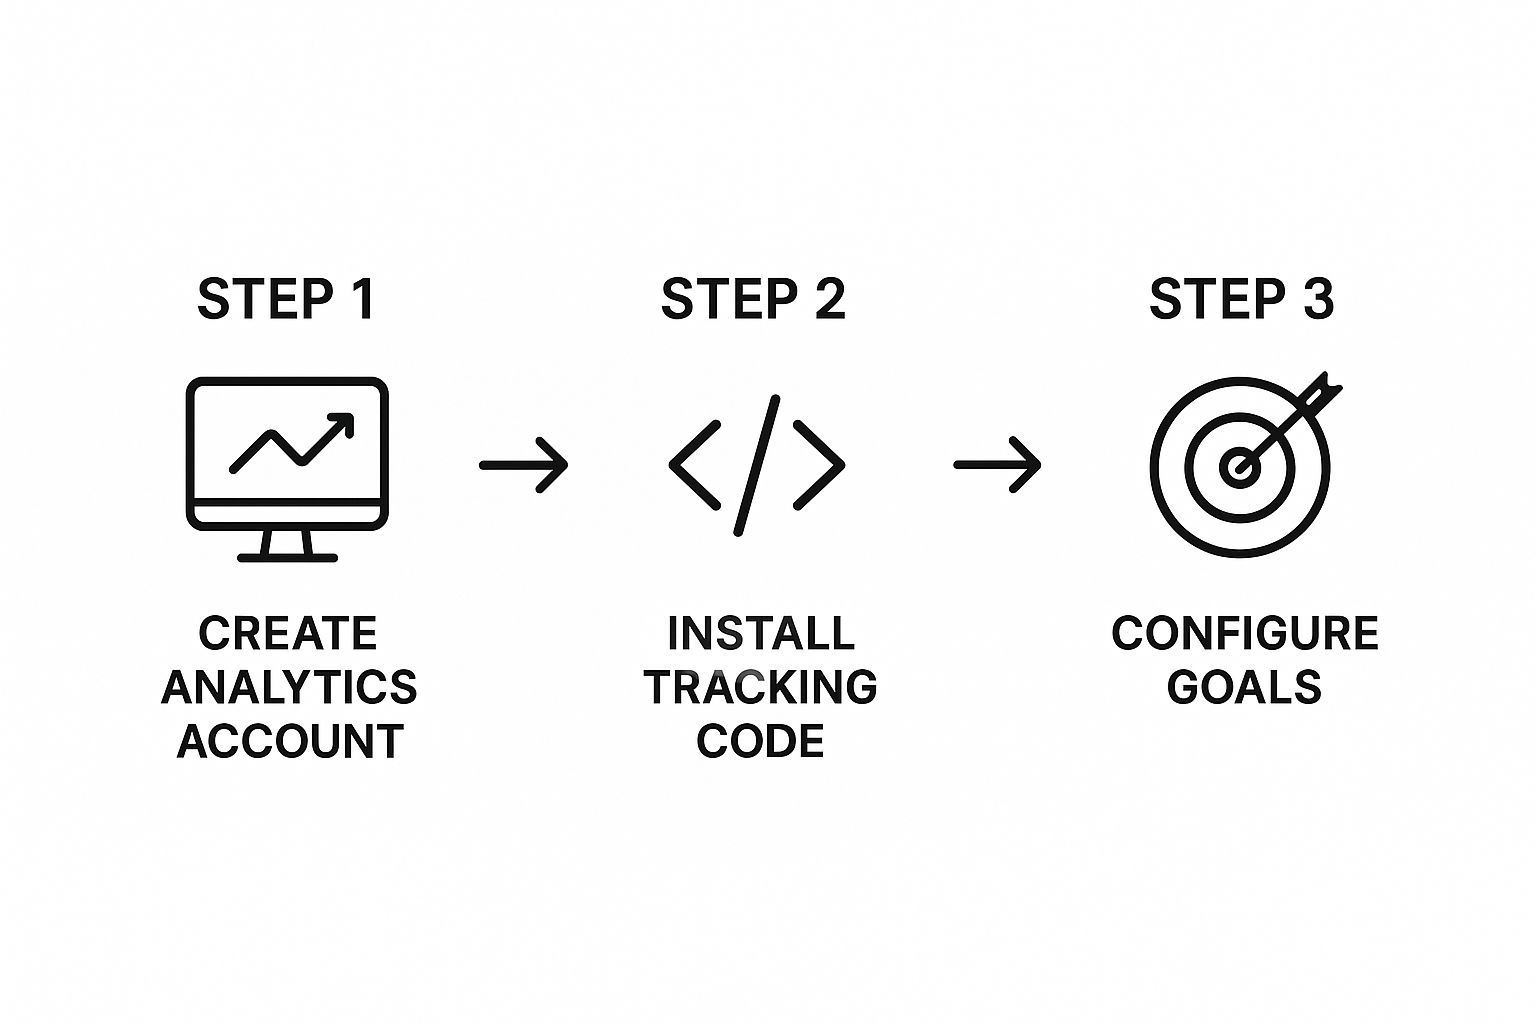
The real takeaway here is that installation is just the start. The data only becomes truly valuable once you've configured goals that align with your business objectives.
Once the code is live, you should start seeing data populating your GA4 reports within 24-48 hours. But your job isn't done. A mistake I see all too often is people forgetting to configure key events from day one.
Pro Tip: Immediately set up tracking for important user actions, which GA4 calls conversions. A conversion isn't just about making a sale. It could be a newsletter signup, a contact form submission, or a key PDF download. Tracking these helps you measure what actually matters to your business.
Unlocking Deeper Insights with Google Search Console
While GA4 is focused on user behavior, Google Search Console is your direct line to Google itself. Setting it up is a separate but equally critical task. You’ll need to verify that you own your website, which you can usually do in a few ways, like adding a DNS record or uploading a simple HTML file to your server.
Once your site is verified, this is where the magic happens: you need to link your GSC account with your GA4 property. This connection feeds incredibly valuable search data directly into your GA4 reports.
- See Organic Search Queries: You’ll finally see the actual keywords people typed into Google to find your website.
- Analyze Landing Page Performance: Find out which of your pages are your top performers in organic search.
- Monitor Technical Health: GSC will alert you to any crawling errors or security issues that could be hurting your traffic.
One of the very first things you should do in GSC is submit your sitemap. A sitemap is just a roadmap of your website that helps Google find and index all of your important pages much more efficiently. Thankfully, most modern CMS platforms can generate one for you automatically.
The Power of A Connected Toolkit
By linking GA4 and GSC, you create an incredibly powerful feedback loop. GSC shows you the search terms that bring people in, and GA4 tells you what those visitors do once they land on your site.
For example, you might see in GSC that you're getting tons of impressions for a keyword but very few clicks. That’s a clear signal that your page is visible, but your title tag or meta description isn't compelling enough to earn the click. On the flip side, GA4 might reveal that visitors from a specific search query have an extremely high bounce rate. This often means your page content doesn't align with what the user was actually looking for.
This combined insight is what takes you from simply collecting numbers to making smart, strategic decisions that improve your performance. Of course, once you have all this data, you need to present it clearly. When you're ready to share your findings, our guide on how to create SEO reports can show you how to turn raw data into a compelling story for clients or stakeholders.
Translating Analytics into Audience Insights

Alright, you’ve got the data flowing into your tools. Now for the fun part: becoming an interpreter. The goal here is to stop just counting visitors and start understanding the people behind those clicks. Raw numbers are only the starting line; the real magic happens when you translate them into actionable insights about your audience.
This is where you graduate from asking "what" to asking "why." Why are certain pages so popular? Why do visitors from social media stick around longer than those from organic search? Answering these questions turns a passive monitoring task into your most powerful strategic advantage.
Painting a Picture of Your Visitors
First things first, you need to know who is actually showing up. Google Analytics 4 is fantastic for this, giving you detailed reports that help you build a clear picture of your typical visitor. This moves them from an abstract "user" in a report to a more defined persona you can speak to.
In your GA4 account, head over to the Reports > Demographics section. This is where you can start piecing things together based on:
- Country and City: Are you pulling in a local crowd or an international one? Seeing a surprising amount of traffic from a new country could be your first clue to an untapped market.
- Age and Gender: Does your content seem to hit the mark with a specific age group? This is gold when it comes to tailoring your messaging and ad campaigns.
- Language: Knowing your users' primary languages helps you decide if creating multilingual content is a smart investment.
Imagine a local bakery seeing a spike in traffic from a neighboring city. That single insight could spark a targeted social media campaign for that specific area, bringing new customers through the door. The trick is to hunt for patterns that either confirm what you thought you knew or challenge your assumptions with new opportunities.
Decoding Behavior Across Different Devices
It’s no secret that people act differently on their phones versus their desktops. Someone killing time on their phone during a commute has a completely different mindset than someone doing deep research on a laptop at home. Because of this, monitoring traffic by device isn't just a good idea—it's essential.
As of July 2025, mobile devices are responsible for a mind-boggling 64.35% of all global web traffic. That's a giant leap from just 0.72% back in 2009. This stat isn't just trivia; it's a fundamental shift in how people use the internet, making mobile optimization a non-negotiable for success.
By segmenting your traffic in GA4 by device category (Desktop, Mobile, Tablet), you can directly compare crucial metrics like Engaged sessions and Conversion rates. If you see that your mobile users have a dismal engagement rate on a key landing page, that's a bright red flag telling you that page needs a mobile-first overhaul.
This analysis helps you find the friction. Is your contact form a pain to fill out on a small screen? Are your beautiful, high-res images making the page crawl on a mobile connection? Answering these questions ensures you’re giving the vast majority of your audience a smooth experience.
What Your Engagement Reports Are Really Saying
Engagement reports are where you discover what content truly connects with your audience. These metrics go far beyond simple pageviews to show you how people are interacting with your site. In GA4, you’ll want to make the Engagement > Pages and screens report your new best friend.
This report will quickly show you your most popular pages by views and users. But don't stop there. The real treasure is the "Average engagement time" metric. A blog post with thousands of views but an average engagement time of only 15 seconds isn't a win. It just means your headline got the click, but the content didn't hold their attention.
Look for the outliers, because they tell a story:
- High Engagement, Low Views: You've found a hidden gem. This content is incredibly valuable to a small group. The next question is, how can you get it in front of a wider, but still relevant, audience?
- High Views, Low Engagement: Your headline and meta description are doing their job, but the content itself is a letdown. It's time to get in there and revise the page to better match what users were expecting.
- High Engagement, High Views: This is your star player. Break down its format, topic, and writing style so you can replicate that success with your future content.
By regularly digging into these reports, you can build a content strategy that’s based on proven performance, not just guesswork. For a closer look at pulling meaningful stories from your data, check out these tips on how to analyze website traffic. This will help you continuously refine your approach and create content your audience actually wants to read.
Knowing who is on your site is one thing, but figuring out how they got there is where you start to unlock real, sustainable growth.
It’s easy to get lost in the weeds of website data. But dissecting your traffic sources isn’t just an academic exercise—it’s how you find out which of your marketing efforts are actually hitting the mark. This is where you connect your actions to tangible results.
Are those long hours you're pouring into SEO paying off? Is that new social media campaign driving engaged users or just empty clicks? By digging into your traffic channels, you can stop guessing and start making decisions with confidence. It’s all about putting your resources where they’ll have the biggest impact.
https://www.youtube.com/embed/zoQVMmOf61M
Your Primary Traffic Sources, Demystified
First things first, let's get a handle on the main ways people find you. In Google Analytics 4, this information is front and center. Just head over to Reports > Acquisition > Traffic acquisition. Think of this report as your command center for understanding where your visitors are coming from.
GA4 does a great job of neatly bucketing your traffic into a few key groups. Here are the ones you'll see most often:
- Organic Search: These are the folks who found you the old-fashioned way—by typing a query into Google or Bing and clicking on one of the regular, unpaid search results. This is a direct reflection of how well your SEO is working.
- Paid Search: This bucket captures anyone who arrived by clicking on one of your paid ads, like a Google Ads campaign.
- Direct: This is your loyal crowd. They either typed your URL right into their browser or used a bookmark to get to you. It's a strong signal of brand awareness and customer retention.
- Social: Clicks coming from platforms like Facebook, LinkedIn, X (formerly Twitter), or Instagram all fall under this category. You can even see the split between your paid and organic social efforts here.
- Referral: Think of this as digital word-of-mouth. It’s traffic that came from a link on another website, essentially sending a recommendation your way.
A healthy mix of traffic sources is usually the sign of a resilient online presence. If you're not overly dependent on a single channel, you're in a much stronger position to weather any unexpected algorithm changes or market shifts.
Go Deeper with Search Console to Find User Intent
While GA4 is great at telling you that people came from organic search, Google Search Console (GSC) tells you exactly what they were looking for. This is the goldmine.
When you link GSC to your GA4 account, you unlock a report that shows the specific search queries that led users to your site. It’s like getting a direct peek into your audience's mind. You’ll find this data back in the Traffic acquisition report, under the "Google" source. This is where you’ll see the actual keywords driving clicks and impressions.
For instance, if you run a home repair blog and see tons of traffic coming from the query "how to fix a leaky faucet," you've just received a crystal-clear signal that creating more helpful, DIY-style content is a very smart move. It validates your content strategy and shows you're aligning with what people actually need.
Analyzing Channel Performance for Smarter Investments
Once you know where people are coming from, the real work begins: figuring out which channels are actually valuable. Let's be honest, not all traffic is created equal. A thousand visitors from a spammy referral site who leave in two seconds are far less valuable than 50 highly engaged visitors from organic search who become customers.
To figure this out, you need to compare some key metrics across your different channels. I always look at:
- Users and Sessions: Which channels bring the most bodies through the door?
- Engaged Sessions: Of those people, who actually interacts with the site in a meaningful way?
- Average Engagement Time: Which channels send users who stick around and actually consume what you've created?
- Conversions: This is the big one. Which channels are driving the actions that truly matter to your business, like sales or sign-ups?
Running this comparison is absolutely crucial for optimizing your budget and your time. If you discover your paid social campaigns have a fantastic conversion rate, you have a solid, data-backed case for increasing your ad spend. If organic search traffic consistently shows the highest engagement time, you know that your investment in SEO and content is a long-term winner.
Of course, it’s impossible to talk about search without acknowledging the 800-pound gorilla in the room. Google's dominance shapes everything. As of May 2025, Google saw a staggering 105.4 billion monthly visits, with its closest competitor, YouTube, pulling in 51.65 billion.
Even though Google's desktop traffic share has dipped slightly from its 2009 peak of around 90.1%, it still completely commands the field. Knowing where the audience congregates is half the battle. You can dive deeper into these website traffic statistics to get the full picture, but the takeaway is clear: understanding the major players helps you target your efforts effectively.
Developing Advanced Monitoring and Reporting Habits

Alright, you've got the hang of tracking who’s visiting your site and how they found you. Now it's time to graduate from simply checking data to building a truly intelligent monitoring system. This is where you evolve from a passive observer into a proactive analyst who gets the right insights at the right time.
The real goal here is to create a workflow that saves you precious time while flagging critical trends before they turn into major problems. This isn’t about being glued to a real-time traffic chart all day. It’s about building a reporting framework that works for you, not the other way around.
Building Custom Reports and Dashboards
Let's be honest: the standard reports in Google Analytics 4 are a solid starting point, but they're built for the masses. Your business is unique, with its own specific goals and key performance indicators (KPIs). The real magic happens when you build custom reports and dashboards that put your most important metrics right in front of you.
For instance, an e-commerce shop owner will want a dashboard that ties traffic sources directly to conversion rates and average order value. In contrast, a content-heavy blog would be better served by a custom report tracking organic traffic, average engagement time per article, and newsletter sign-ups from specific posts.
Inside GA4, you can do this using the "Library" feature. This lets you build and save your own collection of reports and data visualizations, so you're not fumbling through menus every time you need to check on what matters.
The best dashboards are simple and focused. Don’t try to cram every metric you can find onto one screen. Instead, pick the 5-7 KPIs that truly reflect your business objectives. A cluttered dashboard causes analysis paralysis; a focused one drives clear, decisive action.
This personalized setup makes your monitoring process faster, smarter, and infinitely more effective.
Automating Your Reporting Workflow
Manually pulling reports every single week? That’s a habit that's bound to get skipped when things get busy. The cornerstone of any truly advanced monitoring system is automation. By setting up automated email reports, you can keep yourself and your key stakeholders in the loop without adding another recurring task to your plate.
GA4 makes this easy. You can share almost any standard or custom report and schedule it to be emailed out daily, weekly, or monthly. This is incredibly useful for:
- Weekly Performance Summaries: A high-level overview sent to your team every Monday morning to set the tone for the week.
- Monthly Stakeholder Updates: A more comprehensive report for leadership that highlights long-term trends and progress toward goals.
- Campaign-Specific Monitoring: A daily report to track the immediate impact of a new marketing campaign for its entire duration.
When done right, automation transforms reporting from a tedious chore into a reliable, hands-off process. When you’re ready to take these presentations to the next level, exploring the best SEO reporting software can give you even more powerful tools for creating polished, client-ready documents.
Complementary Tools for Deeper Insights
Google Analytics is fantastic at telling you what users did on your site, but it often falls short of explaining why they did it. To get the complete picture, you need to layer in tools that show you what the user experience actually looks and feels like.
Heatmap Software Tools like Hotjar or Microsoft Clarity are perfect for this. They create visual overlays on your web pages that give you a whole new perspective.
- Click Maps: See precisely where users click. Are they engaging with your main call-to-action, or are they frustratedly clicking on a non-interactive image?
- Scroll Maps: See how far down your pages people actually scroll. You might be shocked to find that your most important content is below the fold where few people ever see it.
Session Recorders These tools are like a DVR for your website, providing anonymized recordings of entire user sessions. You can watch a visitor’s mouse movements, clicks, and navigation to pinpoint exactly where they get stuck or confused. It's an invaluable way to build empathy for your users.
This level of detail is crucial, especially on mobile. Consider that mobile devices now account for roughly 59.7% of all global website traffic, a huge leap from under 35% back in 2015. By watching session recordings of mobile users, you might discover that a critical button is nearly impossible to tap on a small screen—an insight that raw numbers would never give you.
Once you have these monitoring habits locked in, you can start diving deeper into specific channels, like optimizing your Google Ads campaigns for better results. Combining the quantitative data from GA4 with the qualitative insights from these behavioral tools gives you a powerful, 360-degree view of your website's performance.
Common Questions About Monitoring Website Traffic
When you first start digging into your website's traffic, a few questions always seem to surface. It's completely normal to wonder if you're looking at the right data or if you're checking in too often (or not enough). Let's clear up some of the most common queries I hear all the time.
Finding the right rhythm for checking your stats is everything. If you're glued to your analytics screen every day, you'll drive yourself crazy trying to react to normal, everyday dips and spikes. But if you wait too long, you could miss a critical issue or a golden opportunity.
How Often Should I Check My Website Traffic?
Honestly, there's no magic number here. The best frequency really hinges on what's happening with your business and what your goals are.
- Daily Peeks: This is really only necessary during high-stakes moments. Did you just launch a big product, kick off a major ad campaign, or send a newsletter to your entire list? A quick daily check-in can tell you if things are working as expected or if you need to make a fast pivot.
- Weekly Reviews: This is the sweet spot for most businesses. Setting aside time once a week lets you see real patterns emerge without getting lost in the daily noise. It’s the perfect cadence for tracking your ongoing marketing efforts and seeing how you're progressing toward quarterly goals.
- Monthly Analysis: Think of this as your high-level strategy session. A deep dive once a month helps you see the bigger picture—long-term growth, which channels are truly performing, and what you should focus on for the next 30 days.
The trick is to be deliberate. Block it out on your calendar like any other important meeting.
Don't just open your dashboard and stare at the graphs. Go in with specific questions, like, "Did that new blog series we published last week actually bring in any leads?" This approach turns a passive task into an active, strategic exercise.
What Is a Good Bounce Rate?
Ah, the classic question. It's one of the most asked—and most misunderstood—metrics in the world of web analytics. The only truthful answer is: it depends entirely on the page.
There is no universal "good" bounce rate. For instance, a blog post that answers a user's specific question might have an 85% bounce rate. If the visitor found their answer and left satisfied, the page did its job perfectly. That's a success! But an 85% bounce rate on your main e-commerce category page? That's a five-alarm fire.
So, instead of chasing some mythical industry average, do this:
- Benchmark against yourself. Look at the bounce rate for your most important pages and track it over time. The goal is to see improvement on pages where you want the user to click deeper into the site.
- Dig into high-bounce pages. If a crucial landing page has a high bounce rate, play detective. Is the content a mismatch for the ad that brought them there? Is the page painfully slow to load? Is the call-to-action buried or confusing?
Focus your energy on lowering the bounce rate for pages that are vital to your business goals—your service pages, product pages, and checkout flow. That's where improvements directly impact your bottom line. A big part of this process is knowing which numbers point to a good outcome, which is a key part of learning how to measure SEO success.
What Tools Are Useful Besides Google Analytics?
Google Analytics is the workhorse, the absolute foundation of traffic monitoring. But to get the full story, you need to layer in other tools that provide a different kind of insight.
- Heatmap & Session Recording Tools: I absolutely love using platforms like Hotjar or Microsoft Clarity. They bring the data to life. Heatmaps show you exactly where people are clicking and scrolling, while session recordings let you watch anonymized videos of real user journeys. You'll quickly spot where people get frustrated or confused.
- SEO Platforms: If you're serious about organic traffic, tools like Ahrefs or Semrush are essential. They go way beyond on-site traffic, helping you track keyword rankings, analyze your backlink profile, and see exactly what your competitors are doing to win in the search results.
- Uptime Monitoring: A simple service like UptimeRobot is a lifesaver. It does one thing and does it well: it tells you the second your website goes down. Your analytics platform can't do that—it can only show you a terrifying drop to zero traffic after the fact.
Ready to stop guessing and start growing? That's Rank provides a powerful, unified dashboard to monitor your keyword rankings, audit your site's health, and track competitor performance in real-time. Get the clear, actionable SEO insights you need to drive organic growth.