In today's fast-paced market, data is the fuel for growth. But raw data is just noise. The key to unlocking its potential lies in transforming complex metrics into clear, actionable insights. This is where a well-designed marketing dashboard becomes your mission control, providing a real-time, visual overview of your performance across all channels. Without it, you are navigating blind, making decisions based on guesswork rather than strategy.
This guide moves beyond generic templates to showcase powerful marketing dashboard examples, breaking down the strategic thinking behind each one. For your marketing strategy's command center to be truly effective in 2025, it must be powered by robust and insightful data, often drawing from advanced AI marketing analytics. We'll explore how different dashboards, from high-level executive summaries to granular channel-specific reports, empower teams to spot trends, optimize campaigns, and drive measurable results.
Below, you will find a curated list of top-tier platforms like Databox, AgencyAnalytics, and more. Each entry includes detailed screenshots, analysis, and direct links to help you find the perfect command center for your business needs. Get ready to discover how to build a dashboard that not only reports on the past but actively shapes your future success.
1. That's Rank
That's Rank! positions itself as a premier all-in-one SEO dashboard, meticulously designed for clarity and actionable insights. It serves as an excellent example of a specialized marketing dashboard by focusing intently on a critical marketing channel: organic search. Its core strength lies in demystifying SEO performance, offering daily-updated Google keyword ranking data through an exceptionally intuitive interface. This platform is built for marketers, agencies, and business owners who need precise, reliable data without the steep learning curve often associated with advanced SEO software.
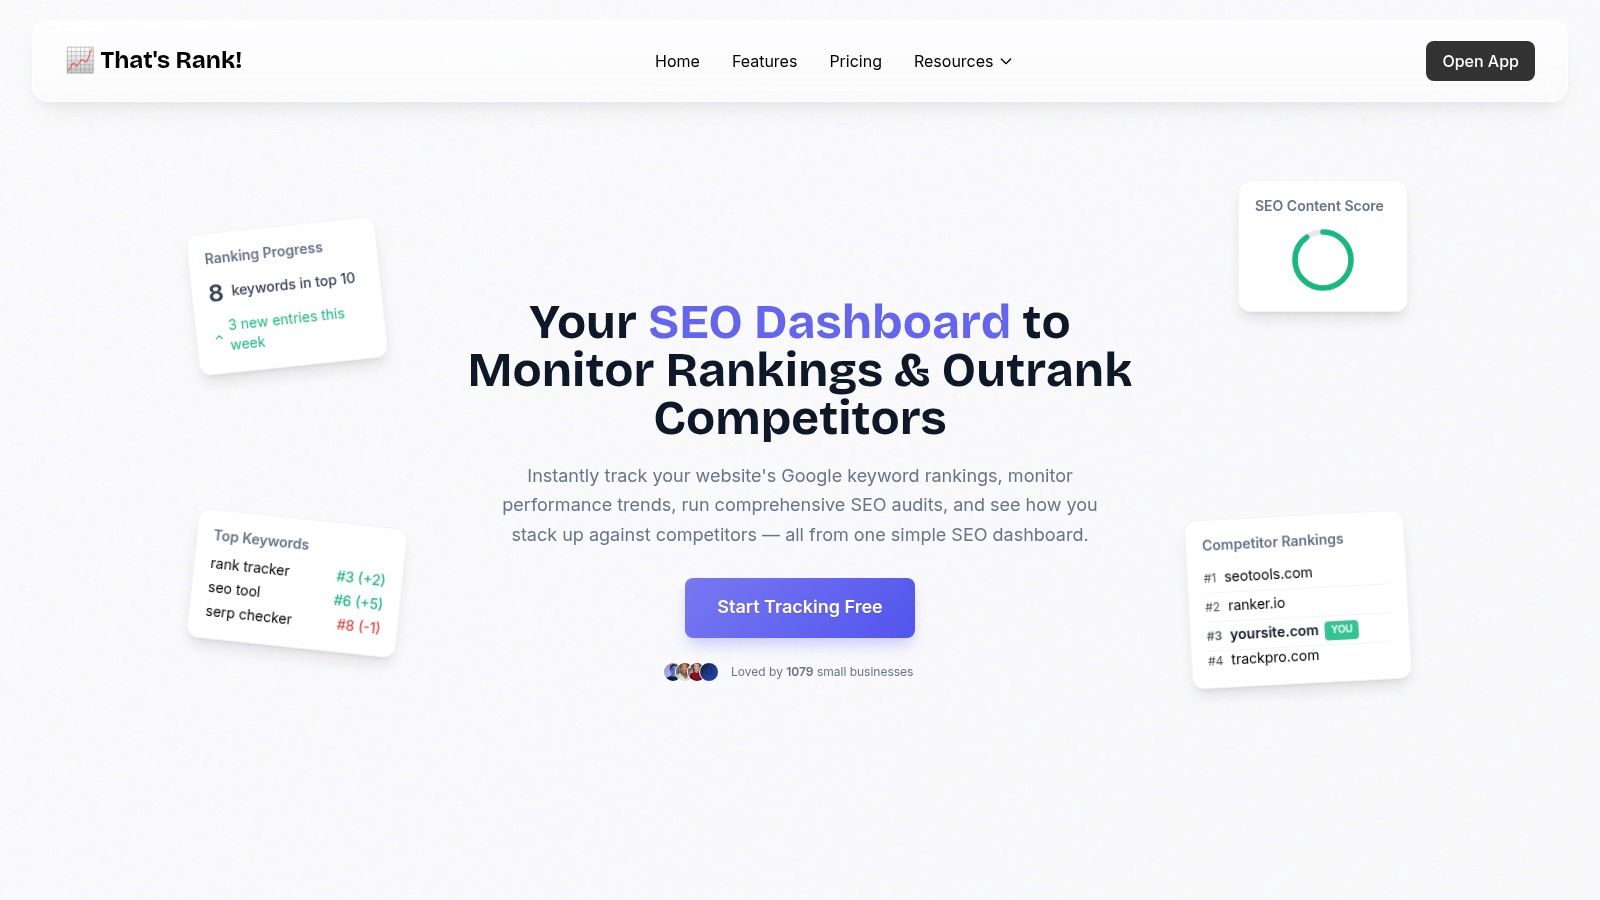
The dashboard excels at presenting complex data, such as historical keyword performance and competitor rankings, in clean, easy-to-digest visual charts. This focus on user experience makes it a standout choice for teams that need to quickly assess performance, identify trends, and make data-driven decisions without getting bogged down in technical jargon.
Strategic Analysis & Key Features
That's Rank! is more than just a rank tracker; it’s a comprehensive SEO command center. Its integrated website health audits provide users with a clear roadmap for on-page and technical SEO improvements. The tool scans your site for issues that could be hindering visibility on Google and delivers actionable recommendations to fix them.
A key differentiator is its real-time competitor monitoring. The dashboard allows you to track not only your own keyword positions but also those of your key rivals. Automated alerts for significant rank changes-both yours and your competitors'-enable swift strategic reactions. This feature transforms the dashboard from a passive reporting tool into an active competitive intelligence asset.
Key Takeaway: The power of That's Rank! lies in its fusion of simplicity and depth. It provides the essential, high-impact data needed for effective SEO management in a format that is accessible to non-experts, while still offering the granularity required by seasoned professionals.
Practical Application & Use Cases
This platform is a powerful tool for demonstrating ROI and communicating progress to stakeholders. Agencies and freelancers can leverage its white-label reporting features to provide clients with professional, easy-to-understand updates on their SEO campaigns.
- For E-commerce: Track rankings for specific product keywords to directly correlate SEO efforts with sales performance.
- For Local Businesses: Monitor local search positions to optimize for "near me" queries and drive foot traffic.
- For Agencies: Manage unlimited client domains from a single dashboard, streamlining reporting and performance analysis across your entire portfolio.
Access and Pricing
That's Rank! offers a flexible pricing structure designed for scalability, making it accessible to a wide range of users.
- Free Plan: A generous free-forever plan is available, allowing you to track one domain and three keywords without requiring a credit card.
- Pro Plans: Paid tiers start at competitive price points, supporting unlimited domains and a higher volume of keywords (up to 500 on the highest plan). This makes it a cost-effective solution for growing businesses and agencies.
You can explore its features and sign up directly on the That's Rank website.
2. Smartsheet
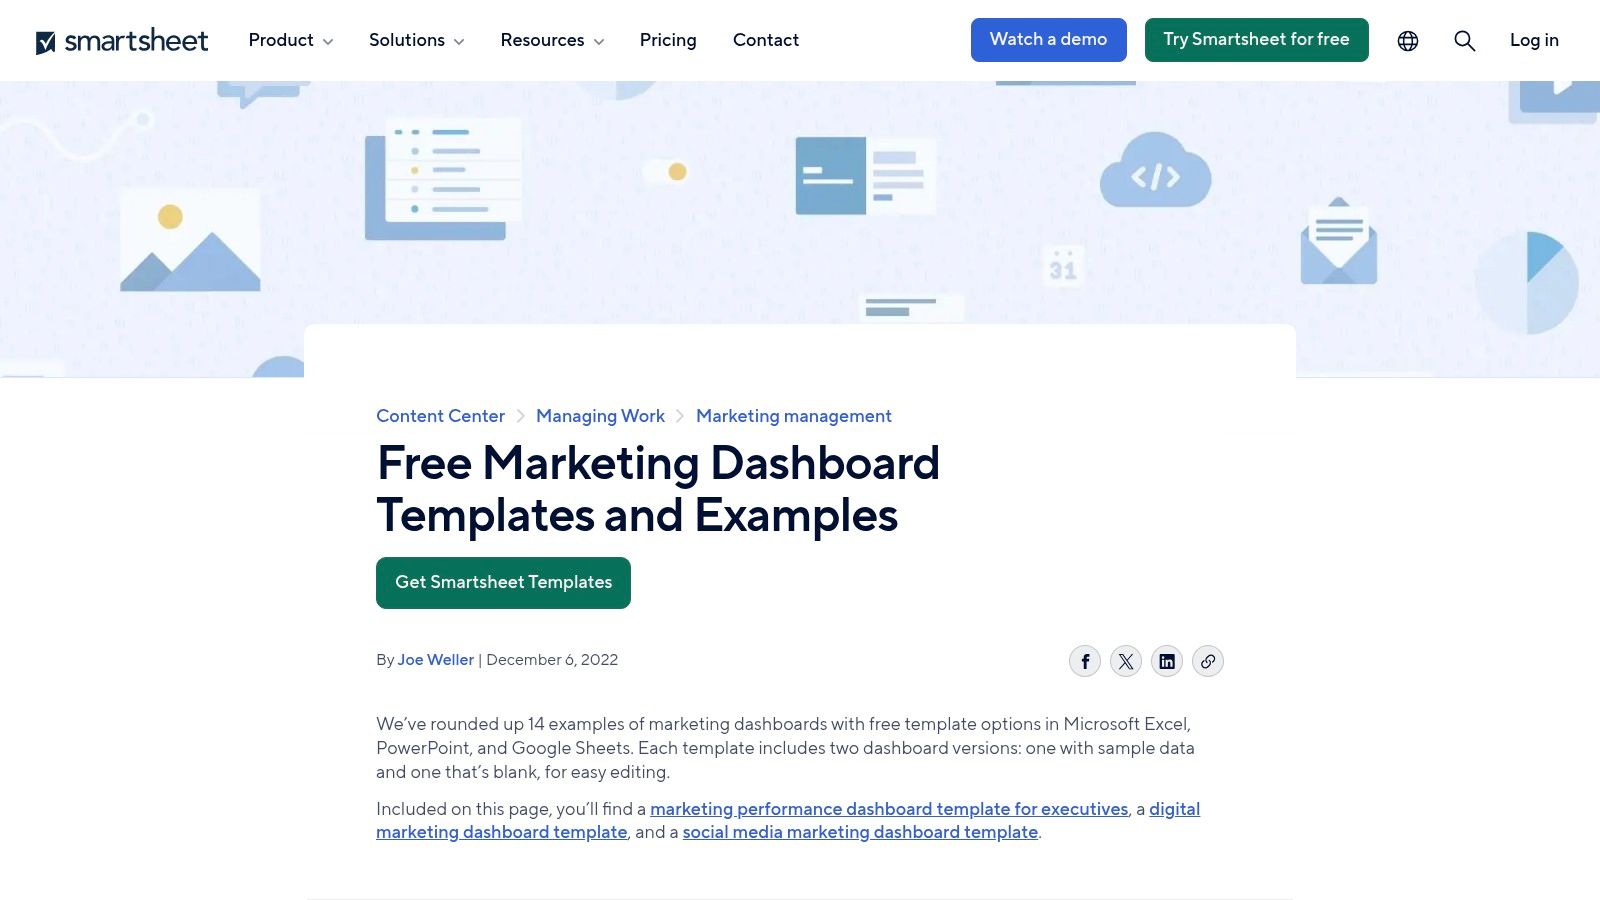
Smartsheet offers a uniquely accessible entry point into data visualization for marketers who are heavily reliant on spreadsheets. Instead of a complex SaaS platform, Smartsheet provides a collection of free, downloadable marketing dashboard templates designed specifically for Microsoft Excel. This makes it an ideal choice for teams or individuals looking for robust, no-cost solutions without a steep learning curve.
The platform stands out by leveraging the familiarity of Excel, eliminating the need to learn a new interface. This is a significant advantage for small businesses or marketing departments where Excel is already the central hub for data management. These templates are not just blank slates; they are pre-configured with essential charts and graphs, offering a plug-and-play experience for visualizing complex data.
Strategic Analysis & Key Offerings
Smartsheet's core strategy is to empower users with structured, yet customizable, tools. While many platforms gatekeep their best templates, Smartsheet offers a comprehensive suite for free, covering a wide range of marketing functions.
Key Dashboard Templates Include:
- CMO Marketing Dashboard: Provides a high-level, executive overview of all marketing activities, from budget allocation to campaign ROI.
- PPC Marketing Dashboard: Focuses on paid advertising metrics, tracking spend, clicks, cost-per-click (CPC), and conversions across different campaigns.
- Marketing Funnel Dashboard: Visualizes the customer journey, from awareness and leads down to conversion, helping identify bottlenecks.
- Marketing Leads Dashboard: Zeroes in on lead generation, tracking sources, quality, and conversion rates for the sales team.
Strategic Insight: By offering these templates in a universally used format like Excel, Smartsheet effectively democratizes data visualization. It allows marketers to create powerful, professional-looking reports without investing in expensive BI software, making it a powerful resource for budget-conscious teams.
Practical Tips for Use
To maximize the value of Smartsheet's templates, focus on data integrity. Since most data entry is manual, establish a consistent process for updating the spreadsheets. Use Excel’s data validation features to minimize errors. For more advanced use, explore Power Query within Excel to automate data imports from other sources, like CSV exports from Google Analytics or your CRM, reducing manual workload and turning these templates into semi-automated marketing dashboard examples.
Website: Smartsheet Marketing Dashboard Templates
3. DashThis
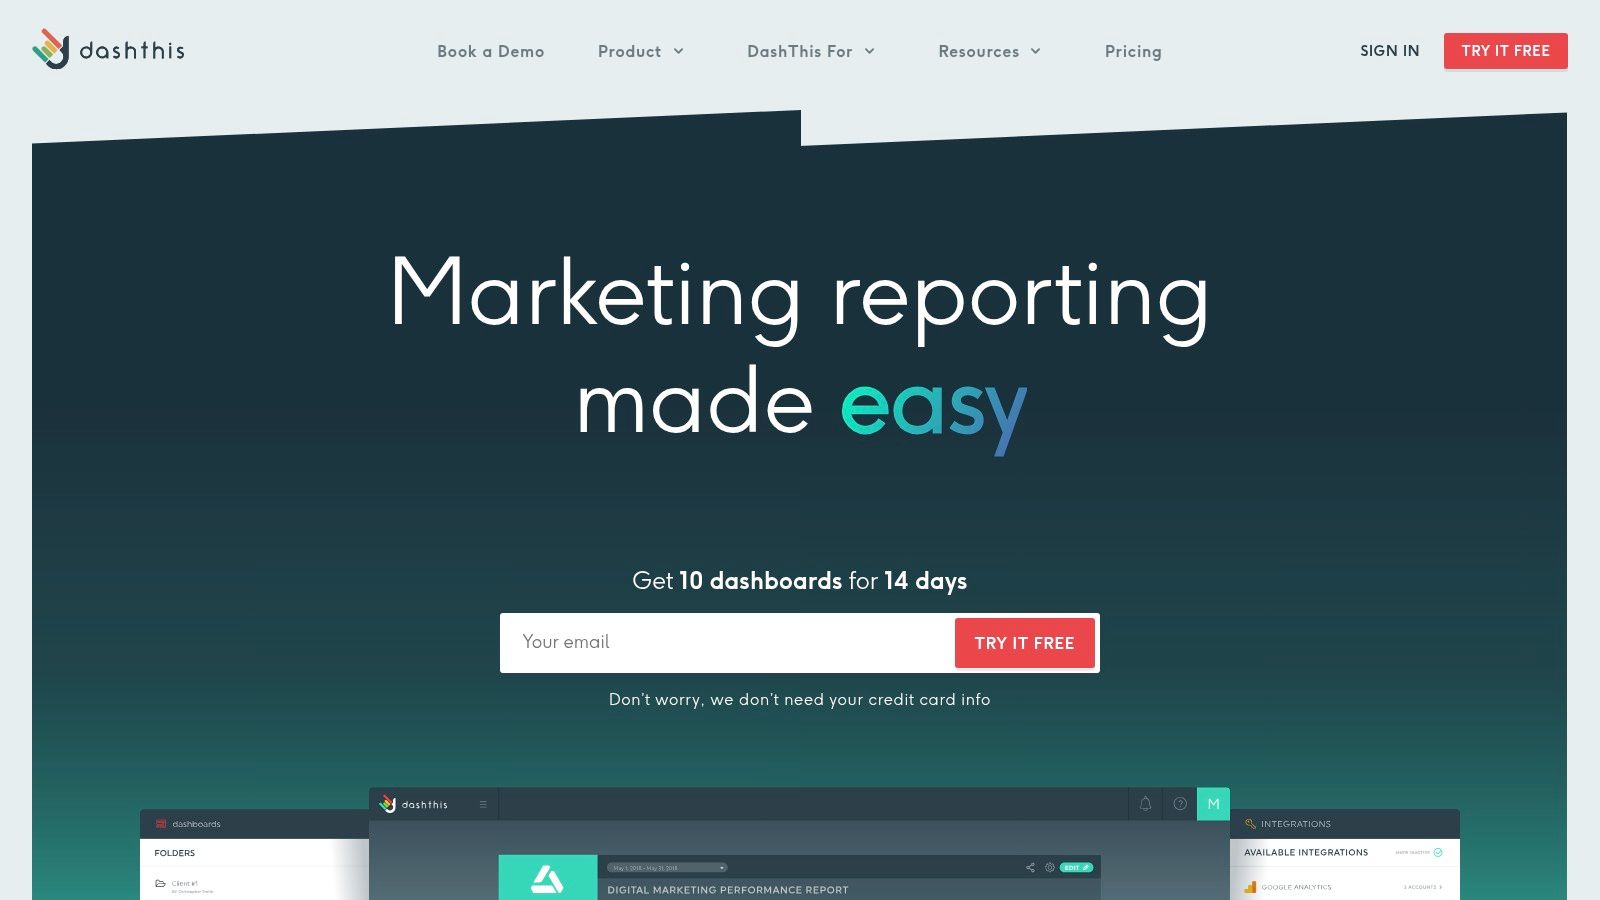
DashThis specializes in automated marketing reporting, making it an excellent choice for agencies and in-house teams managing multiple data sources. The platform is designed to streamline the reporting process by connecting directly to popular marketing tools, pulling data automatically, and presenting it in clean, easy-to-understand dashboards. Its primary value lies in saving marketers hours of manual data compilation.
The user interface is built for simplicity and speed, allowing even non-technical users to create comprehensive reports without a significant learning curve. DashThis distinguishes itself by focusing purely on reporting automation and visualization, rather than offering a full suite of marketing execution tools. This dedicated focus results in a highly polished and efficient reporting experience.
Strategic Analysis & Key Offerings
DashThis's strategy centers on providing a scalable, time-saving solution for client and executive reporting. It achieves this through a robust library of integrations and pre-built templates that cover nearly every aspect of digital marketing, from SEO to social media advertising.
Key Dashboard Templates Include:
- SEO Report Dashboard: Tracks key metrics like organic sessions, keyword rankings, and backlinks, integrating data from tools like Google Analytics and Ahrefs.
- PPC Report Dashboard: Consolidates performance data from Google Ads, Facebook Ads, and LinkedIn Ads into a single view of spend, clicks, and conversions.
- E-commerce Dashboard: Focuses on sales-driven metrics, including revenue, average order value, and conversion rate, often pulling from Google Analytics or Shopify.
- Social Media Dashboard: Aggregates engagement and performance metrics across platforms like Facebook, Instagram, and Twitter.
Strategic Insight: The core strength of DashThis is its "set it and forget it" automation. By scheduling reports to be sent automatically to clients or stakeholders, it transforms reporting from a recurring manual task into an automated asset. This allows agencies to scale their client load without a proportional increase in administrative overhead.
Practical Tips for Use
To get the most out of DashThis, start by leveraging its pre-built templates and then customize them to fit your specific KPIs. Use the custom widget builder to create unique visualizations that answer your key business questions. For client-facing reports, take advantage of the white-label features to add your own branding, creating a professional and seamless experience. While pricing can be a consideration for smaller users, the time saved on report generation often provides a clear ROI for agencies and larger teams managing complex marketing dashboard examples.
Website: DashThis
4. AgencyAnalytics
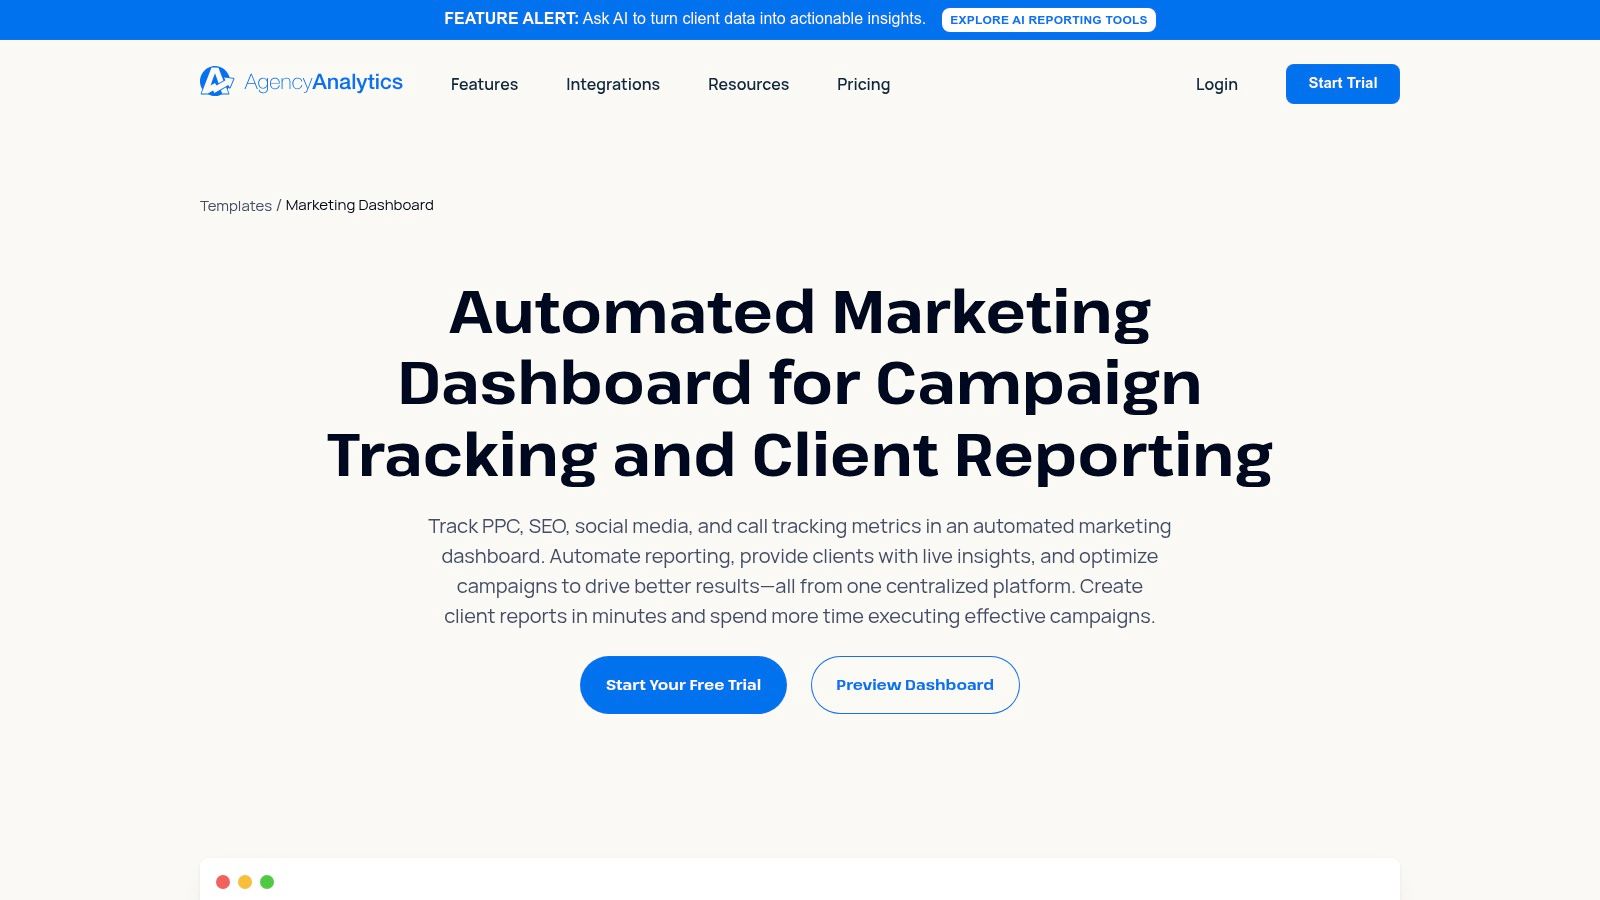
AgencyAnalytics provides an all-in-one marketing reporting platform specifically engineered for digital agencies and their clients. It excels at consolidating data from a vast array of marketing channels into a single, intuitive interface, solving the common agency problem of fragmented reporting. The platform's core strength lies in its powerful automation and white-labeling capabilities, allowing agencies to deliver professional, branded reports with minimal manual effort.
This focus on agency-centric features makes it a standout choice for teams managing multiple client accounts. Instead of juggling dozens of native platform logins, users can build comprehensive, drag-and-drop marketing dashboard examples that pull live data from over 80 integrations. This centralization saves countless hours and provides a holistic view of campaign performance for both the agency and the client.
Strategic Analysis & Key Offerings
The strategic advantage of AgencyAnalytics is its deep integration library combined with robust client management tools. It's not just a dashboard builder; it's a complete reporting workflow solution. The platform allows agencies to create customized report templates, schedule automated delivery, and give clients their own branded login to view live data.
Key Dashboard Capabilities:
- SEO Dashboard: Combines rank tracking, backlink monitoring (via Majestic or Ahrefs integration), and Google Analytics data for a complete SEO performance overview.
- PPC Dashboard: Aggregates metrics from Google Ads, Facebook Ads, LinkedIn Ads, and more, showing total ad spend, ROAS, and conversions in one place.
- Social Media Dashboard: Tracks engagement, follower growth, and post-performance across all major social networks.
- Email Marketing Dashboard: Integrates with platforms like Mailchimp to display campaign open rates, click-through rates, and list growth alongside other marketing efforts.
Strategic Insight: By automating the data collection and report generation process, AgencyAnalytics shifts an agency's focus from tedious manual reporting to high-value strategic analysis. The white-label feature elevates an agency's professionalism, reinforcing their brand and improving client retention.
Practical Tips for Use
To get the most out of AgencyAnalytics, start by creating a master dashboard template that includes the core KPIs you report on for every client. You can then clone and customize this template for each new client, ensuring consistency while allowing for specific adjustments. Use the automated report scheduling to send weekly or monthly updates, keeping clients informed without adding to your workload. Explore its functionality as one of the best SEO reporting tools for agencies to streamline client communication and prove campaign value effectively.
Website: AgencyAnalytics Marketing Dashboard
5. Zoho Analytics
Zoho Analytics serves as a powerful, full-stack business intelligence (BI) platform that excels at creating comprehensive and highly detailed marketing dashboards. It positions itself as an enterprise-grade solution accessible to businesses of all sizes, offering the ability to connect and blend data from a vast array of sources. This capability allows marketers to move beyond siloed reports and build a single, unified view of their entire marketing ecosystem.
What sets Zoho Analytics apart is its integration of AI-powered assistance through Zia, its intelligent assistant. Users can ask questions in natural language, like "What was our total lead count from Facebook last month?", and receive instant reports and visualizations. This feature significantly lowers the barrier to entry for complex data analysis, empowering teams to uncover insights without needing dedicated data scientists. The platform’s real-time data syncing ensures that the marketing dashboard examples created are always up-to-date.
Strategic Analysis & Key Offerings
Zoho's strategy is to provide a scalable, all-in-one analytics environment. It moves beyond simple template provision by offering a robust platform where users can build custom reports from scratch or heavily modify pre-built ones. Its extensive connectivity is a key differentiator.
Key Dashboard Capabilities Include:
- Cross-Channel Marketing Dashboard: Blends data from Google Ads, Facebook Ads, Google Analytics, and email platforms to provide a holistic view of campaign performance and attribution.
- Website Analytics Dashboard: Offers deep insights into user behavior, traffic sources, and conversion funnels. Users can create a powerful website analytics dashboard to monitor key site health metrics.
- Social Media Analytics Dashboard: Consolidates metrics from various social platforms to track engagement, audience growth, and post-performance in one place.
- Sales & Marketing Alignment Dashboard: Integrates with Zoho CRM or other CRMs to connect marketing efforts directly to sales outcomes, tracking lead-to-customer conversion rates and revenue impact.
Strategic Insight: Zoho Analytics empowers marketers to prove their value by directly linking activities to revenue. Its ability to merge data from marketing automation tools with CRM data makes it possible to build dashboards that track the entire customer lifecycle, from first touchpoint to final sale, providing undeniable ROI metrics.
Practical Tips for Use
To get the most out of Zoho Analytics, start by connecting your most critical data sources, such as your website analytics, primary ad platforms, and CRM. Use the pre-built dashboards as a starting point, then customize them by adding or removing widgets to fit your specific KPIs. Leverage the AI assistant, Zia, to quickly explore your data and identify trends you might have otherwise missed. For collaboration, use the sharing and embedding features to provide stakeholders with live, interactive reports instead of static PDFs.
Website: Zoho Analytics Marketing Dashboards
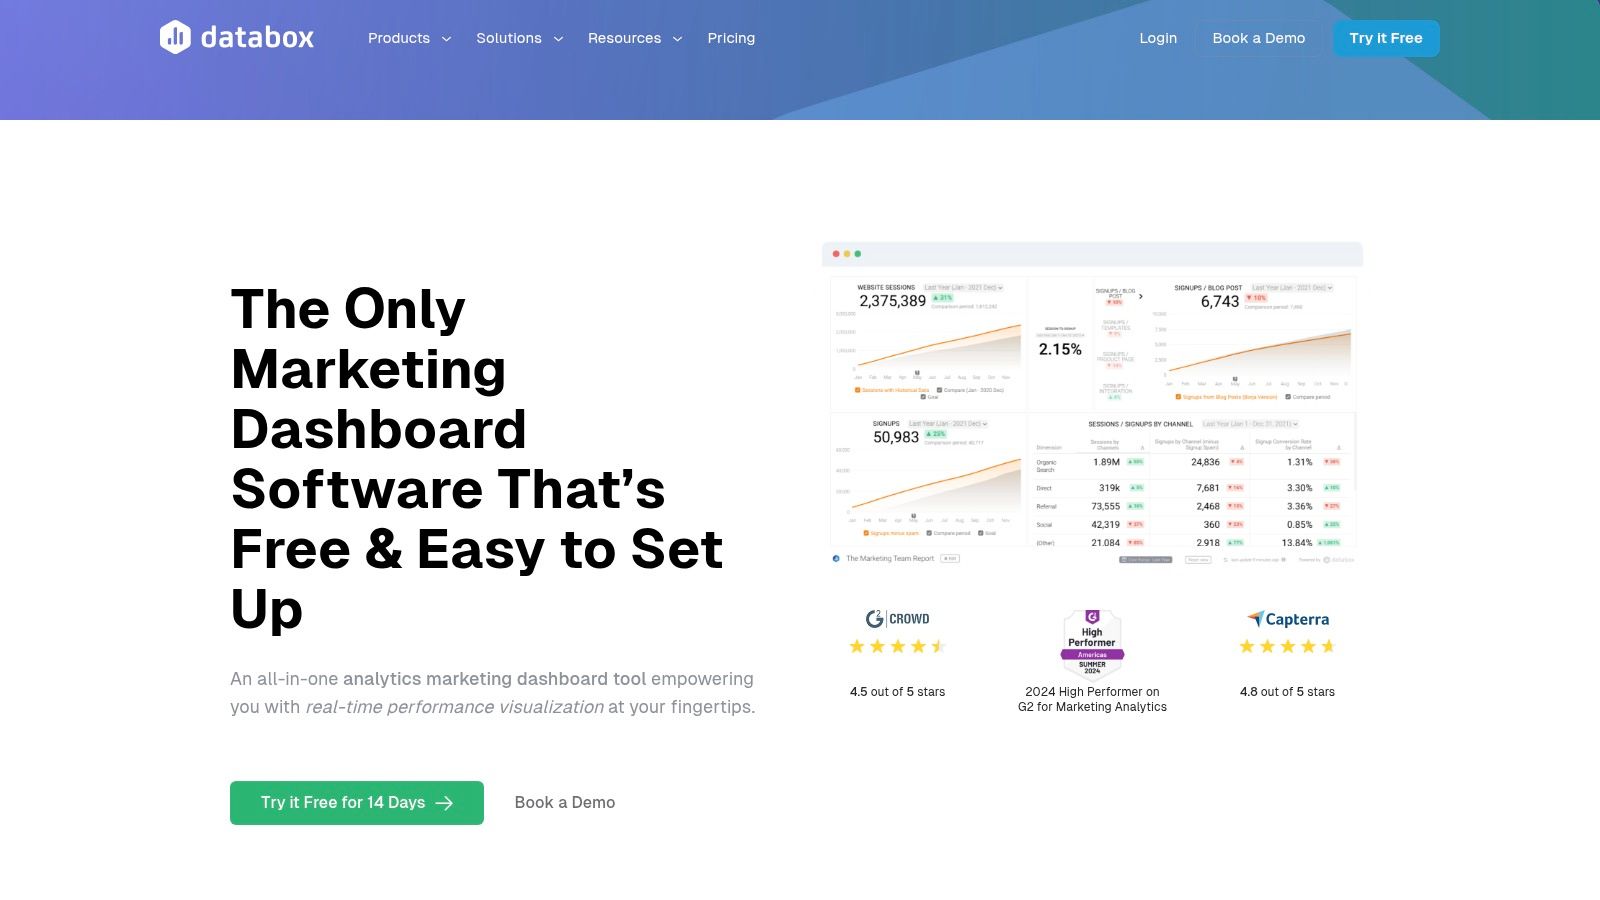
6. Databox
Databox serves as a powerful, real-time business analytics platform that excels at pulling data from numerous sources into a single, cohesive view. It is designed for marketers who need instant access to performance metrics without manually compiling reports. The platform’s strength lies in its extensive library of integrations and pre-built templates, allowing for rapid deployment of sophisticated dashboards.
This focus on speed and accessibility makes Databox a go-to choice for agencies and in-house marketing teams that manage multiple channels. Its user-friendly, drag-and-drop interface empowers users to create highly customized reports, making it one of the most versatile marketing dashboard examples available for tracking KPIs from platforms like Google Analytics, HubSpot, and social media channels simultaneously.
Strategic Analysis & Key Offerings
Databox’s core strategy is to simplify data aggregation and visualization through automation and pre-configured solutions. It removes the technical barriers often associated with BI tools, offering a plug-and-play experience with over 70 one-click integrations.
Key Dashboard Features Include:
- Massive Template Library: With over 200 pre-built dashboard templates, users can quickly visualize data for SEO, social media, paid ads, and content marketing.
- DIY Dashboard Designer: A drag-and-drop editor allows for full customization, enabling marketers to build dashboards that precisely match their reporting needs.
- Real-Time Data: Dashboards automatically refresh, providing up-to-the-minute insights crucial for agile marketing teams making time-sensitive decisions.
- Goal Setting & Alerts: Users can set performance goals directly within dashboards and receive automated alerts when metrics are on or off track.
Strategic Insight: Databox democratizes real-time analytics by combining a vast template library with a user-friendly custom designer. This hybrid approach enables teams to start fast with proven layouts and then evolve their dashboards as their strategic needs become more complex, without needing a data analyst.
Practical Tips for Use
To get the most out of Databox, start by connecting your most critical data sources, like Google Analytics and your primary advertising platform. Use a pre-built template as your foundation and then customize it using the DIY designer. Add specific KPIs that align with your current campaign goals. For agencies, leverage the white-label features to create branded, client-facing reports. Be mindful that while many integrations are seamless, some require minor configuration; review the documentation for each new source you connect to ensure data accuracy.
Website: Databox Marketing Dashboard Software
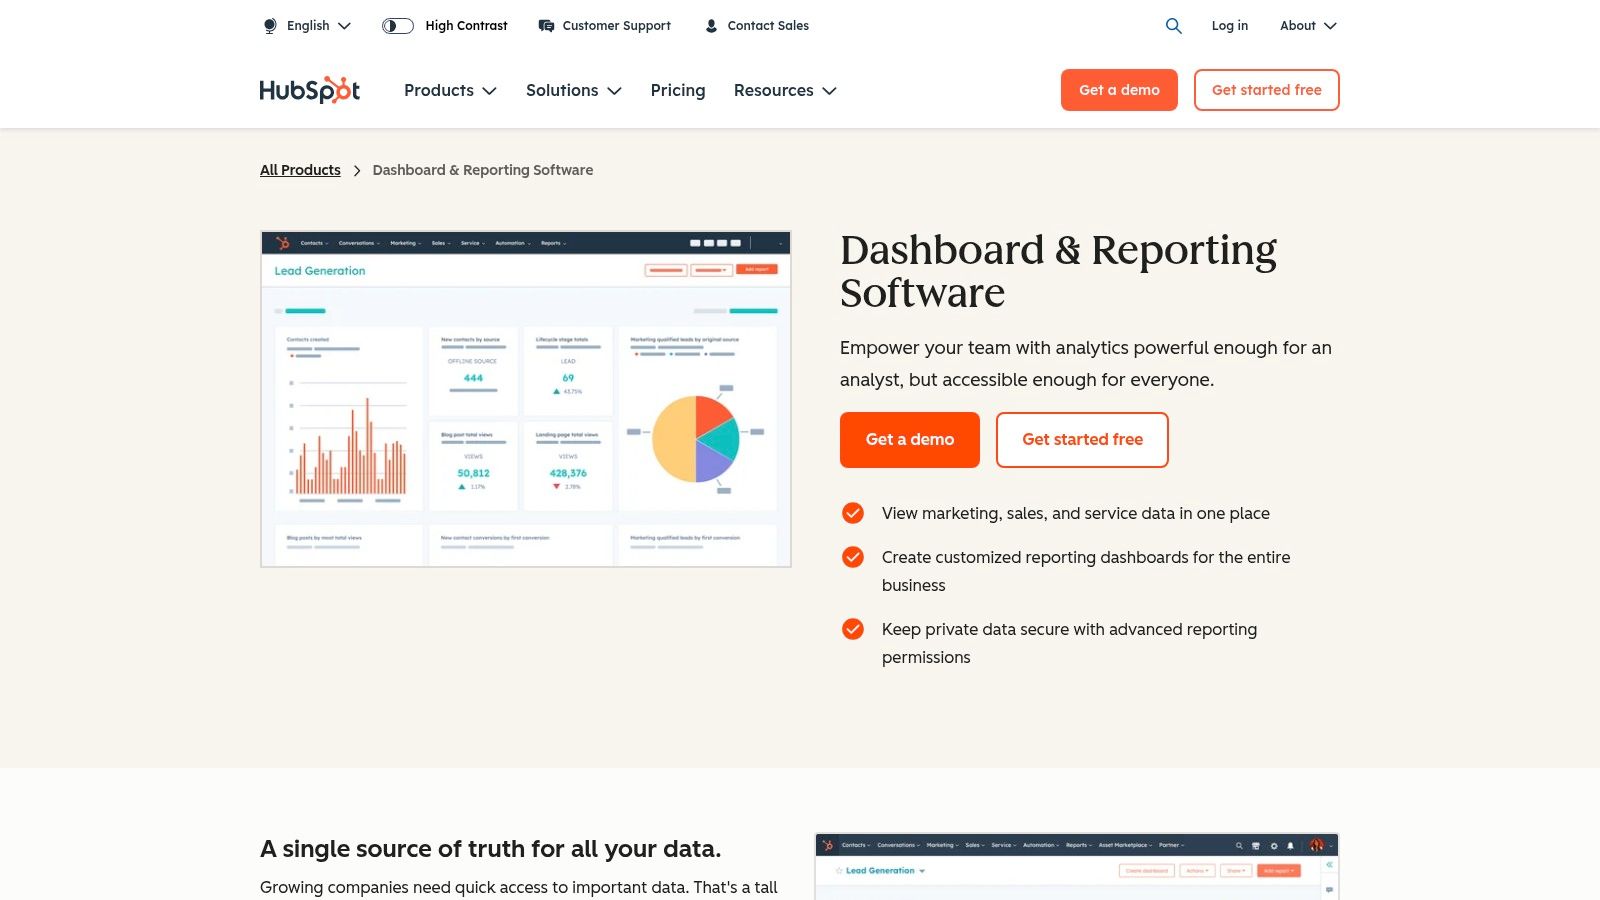
7. HubSpot
HubSpot excels by offering a deeply integrated reporting platform that unifies marketing, sales, and service data into a single source of truth. Unlike standalone analytics tools, HubSpot’s power lies in its all-in-one ecosystem, allowing marketers to create comprehensive dashboards that track the entire customer lifecycle. This holistic view is crucial for businesses looking to connect marketing efforts directly to sales outcomes and customer satisfaction.
The platform provides a user-friendly, drag-and-drop dashboard editor that empowers users to build custom reports without needing technical expertise. This ease of use, combined with the ability to pull data from its native CRM, Marketing Hub, Sales Hub, and Service Hub, makes it a powerhouse for data-driven decision-making. It’s an ideal solution for teams that have outgrown disconnected spreadsheets and need a scalable, centralized platform.
Strategic Analysis & Key Offerings
HubSpot's core strategy is to provide an end-to-end view of the customer journey, making it one of the most powerful marketing dashboard examples for measuring full-funnel impact. By connecting marketing campaign data with sales pipeline and customer service tickets, it enables a level of analysis that is difficult to achieve with disparate tools.
Key Dashboard Capabilities:
- Marketing & Sales Alignment: Build reports that show how specific marketing campaigns (e.g., a blog post or email) generated leads that turned into closed-won deals.
- Custom Report Builder: Create visualizations from scratch using any contact, company, deal, or ticket property stored in the HubSpot CRM.
- Pre-Built Templates: Access a library of ready-to-use reports for tracking website traffic, lead generation, email performance, and sales activity.
- Granular Permissions: Control which team members can view or edit specific dashboards, ensuring data security and relevance for different roles.
Strategic Insight: The true value of HubSpot's dashboards is their ability to break down departmental silos. When a marketing team can see which content sources generate the most valuable customers (not just leads), they can optimize their strategy for revenue, not just vanity metrics. This direct link to the bottom line is its key differentiator.
Practical Tips for Use
To get the most out of HubSpot, start by defining your key business questions. Don't just replicate standard reports; instead, build dashboards that answer specific strategic questions like, "Which of our marketing channels has the highest lead-to-customer conversion rate?" Use custom properties in the CRM to tag contacts and deals with relevant data, which can then be used in your reports for deeper segmentation. For those managing client campaigns, you can learn more about how to structure a HubSpot-powered report from this guide on building an SEO client dashboard.
Website: HubSpot Reporting & Dashboards
Marketing Dashboard Tools Feature Comparison
| Tool | Implementation Complexity 🔄 | Resource Requirements ⚡ | Expected Outcomes 📊 | Ideal Use Cases 💡 | Key Advantages ⭐ |
|---|---|---|---|---|---|
| That's Rank | Low - intuitive, no technical expertise | Moderate - flexible pricing, unlimited tracking on higher plans | Accurate daily SEO keyword rankings & health audits | Businesses, marketers, agencies needing SEO insights | Real-time competitor monitoring and alerts |
| Smartsheet | Low - Excel templates, manual setup | Low - free downloadable templates | Basic marketing KPI tracking & visualization | Teams familiar with Excel needing customizable templates | Free, diverse marketing templates |
| DashThis | Medium - connects multiple platforms | Moderate - subscription pricing | Automated marketing reports from integrated data | Marketing teams wanting automated, custom dashboards | Automated reporting, diverse integrations |
| AgencyAnalytics | Medium - some learning curve | High - pricing geared to agencies | Centralized client marketing dashboards | Agencies managing multiple clients | Extensive integrations and white-label reporting |
| Zoho Analytics | High - setup and AI features require time | High - scalable, advanced BI tools | AI-powered analytics with real-time dashboards | Businesses needing advanced AI analytics and multiple data sources | Extensive integrations, AI analytics |
| Databox | Low-medium - quick setup with templates | Moderate - subscription plans | Real-time marketing performance tracking | Teams needing fast deployment and real-time updates | 200+ pre-built templates, DIY dashboard designer |
| HubSpot | Medium - integrated platform | High - premium pricing | Centralized marketing, sales, service insights | Businesses needing all-in-one data reporting | Strong integrations and centralized dashboards |
From Examples to Execution: Building Your Ultimate Dashboard
Throughout this guide, we've journeyed through a diverse landscape of powerful marketing dashboard examples. From the client-centric reporting of AgencyAnalytics and DashThis to the comprehensive business intelligence of Zoho Analytics and Smartsheet, a clear theme emerges: the most effective dashboards are more than just data repositories. They are strategic command centers that transform raw numbers into actionable intelligence.
The examples from Databox and HubSpot highlight the power of integration, pulling disparate data sources into a single, cohesive view. We've seen how a well-designed dashboard can align teams, justify marketing spend, and pinpoint opportunities for growth with precision. The key takeaway is that the "perfect" dashboard is not a one-size-fits-all template; it's a customized tool built around your unique business objectives.
Synthesizing the Insights: Your Action Plan
Moving from inspiration to implementation requires a structured approach. The goal is to build a dashboard that serves as a dynamic, living document that evolves with your marketing strategy. Don't just replicate the marketing dashboard examples we've shown; adapt their underlying principles to fit your specific needs.
Here is a step-by-step framework to guide your process:
- Define Your "Why": Start with your core business goals. Are you primarily focused on driving top-of-funnel awareness, generating qualified leads, increasing customer lifetime value, or improving client retention? Your primary objective dictates which metrics matter most.
- Know Your Audience: A dashboard for your CMO should provide a high-level overview of ROI and market penetration. In contrast, a dashboard for a content team needs granular data on page performance, keyword rankings, and engagement metrics. Tailor the complexity and KPIs to the end-user.
- Map Your KPIs to Goals: For each goal, identify the Key Performance Indicators (KPIs) that directly measure progress. For lead generation, this might be Conversion Rate, Cost Per Lead, and MQL-to-SQL Rate. For SEO, it could be Organic Traffic, Keyword Rankings, and Backlink Velocity.
- Prioritize Integrations: List all the platforms in your marketing stack (e.g., Google Analytics, your CRM, social media platforms, email marketing software). Your chosen dashboard tool must integrate seamlessly with these sources to automate data collection and ensure accuracy.
Choosing the Right Tool and Looking Ahead
Selecting the right platform is critical. For small businesses or those focused heavily on organic growth, a specialized tool like That's Rank offers deep SEO insights without overwhelming complexity. For larger enterprises or agencies, a more robust solution like Zoho Analytics or Databox might be necessary to handle vast and varied data streams.
As you build, consider incorporating more nuanced data points to gain a competitive edge. For instance, analyzing customer service interactions can reveal valuable voice-of-the-customer data. Integrating metrics from chatbot analytics can provide a real-time pulse on user queries and pain points, enriching your overall marketing intelligence.
Ultimately, remember that your dashboard is not a static report. It's a strategic asset that requires continuous refinement. Set aside time each quarter to review its effectiveness. Are the KPIs still relevant? Does the layout still provide clarity? Answering these questions ensures your dashboard remains a powerful engine for data-driven decision-making and sustainable growth.
Ready to stop guessing and start measuring what truly matters for your SEO? The marketing dashboard examples in this article show the power of focused data. That's Rank provides an intuitive, powerful SEO dashboard designed to turn complex ranking data into a clear, actionable growth strategy. Try That's Rank today and build the SEO command center your business deserves.