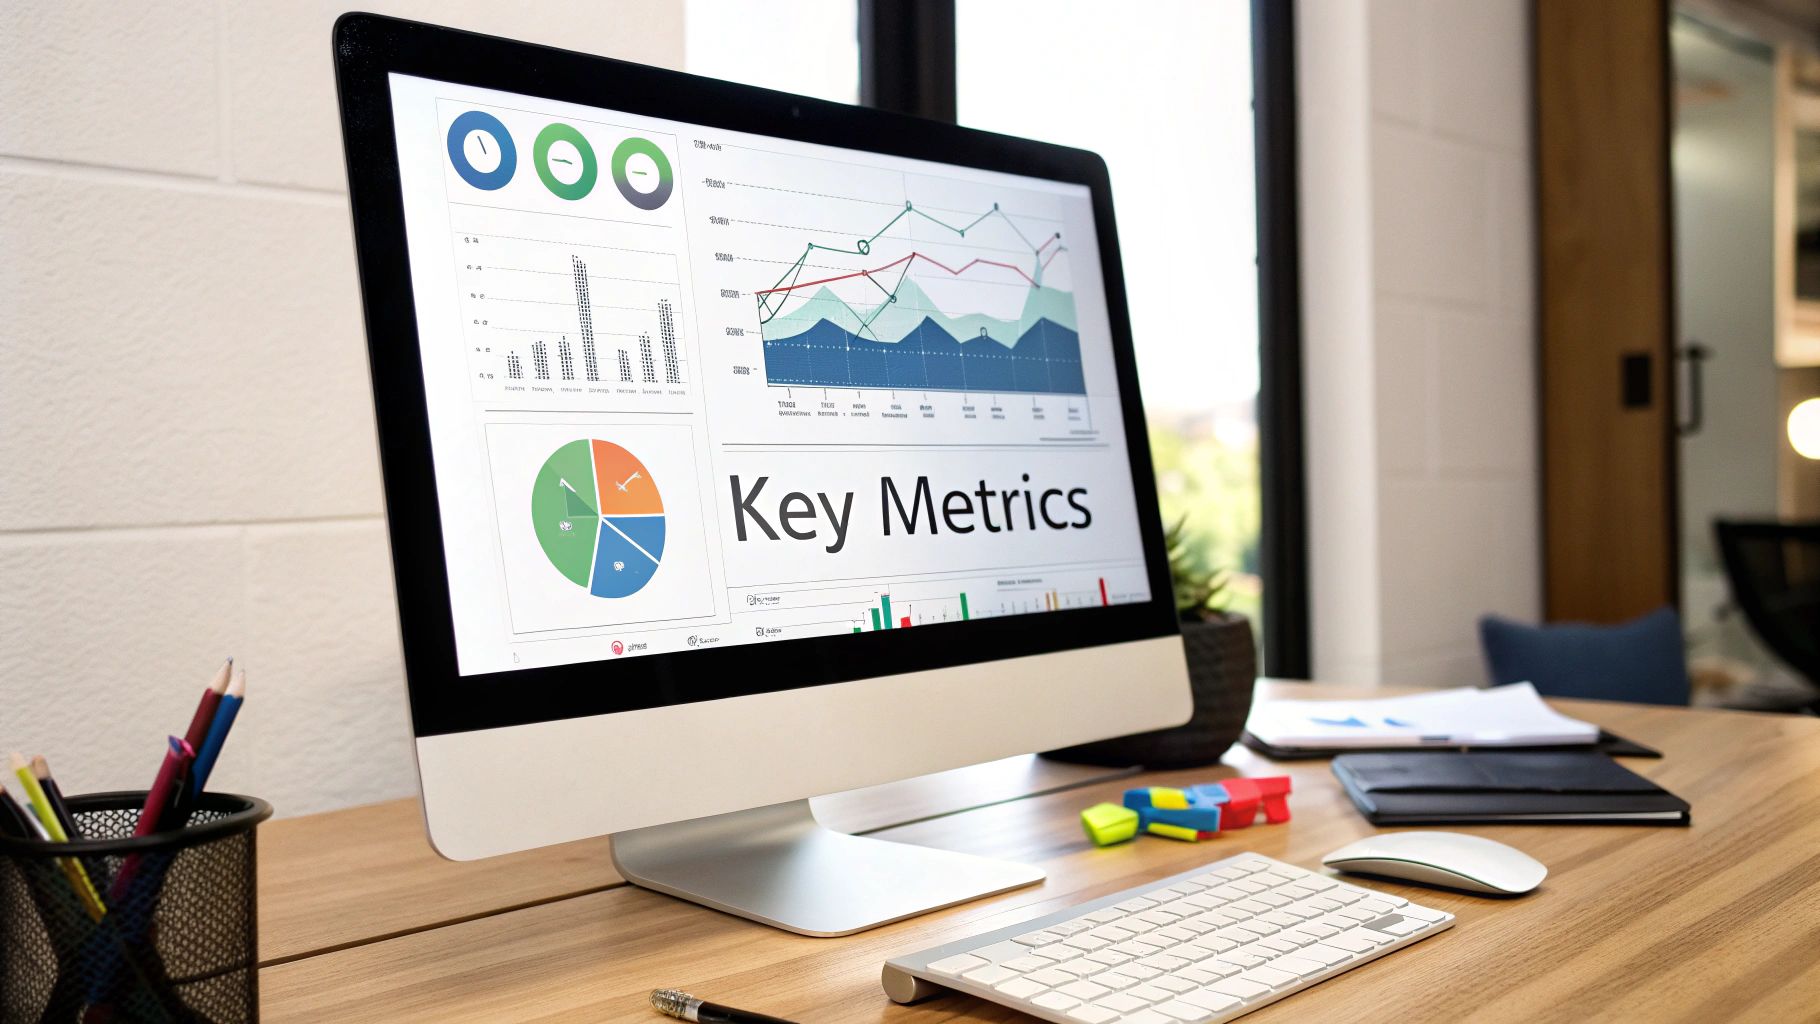
An SEO reporting dashboard isn't just another report; it's a living, visual command center for your entire search strategy. Think of it as an interactive interface that pulls all your critical performance data from tools like Google Analytics and Google Search Console into one single, easy-to-digest view. It’s designed to cut through the noise and show you what actually matters.
Your Command Center for SEO Growth
Trying to run an SEO campaign without a solid dashboard is a lot like trying to fly a plane with half the instruments blacked out. You might be moving, but you have no real idea if you're heading in the right direction, how high you are, or what's coming up ahead. It’s all guesswork and gut feelings.
An SEO reporting dashboard is your cockpit. It’s not a static, boring spreadsheet you glance at once a month. It’s a dynamic hub that pipelines in real-time data, transforming rows of confusing numbers into clear, actionable insights.
From Data Overload to Strategic Clarity
Let's be honest, raw data is overwhelming. A good dashboard gives you a clean, at-a-glance view of your most important metrics. This visual approach means you can instantly spot what's working, catch problems before they spiral, and uncover those hidden-gem opportunities for growth. It’s the difference between having a pile of ingredients and a recipe to follow.
The real job of an SEO reporting dashboard is to tell a story with your data. It answers the one question everyone wants to know: "Is our SEO strategy actually working?" by showing you the trends and tangible results over time.
This clarity is absolutely essential. When you consider that around 53% of all website traffic comes from organic search, the stakes are high. And with SEO sometimes delivering an incredible ROI of up to 748%, you can't afford to fly blind. A dashboard gives you the agility to react to algorithm shifts and capitalize on what's driving traffic right now. You can dive deeper into these powerful SEO statistics at keyword.com.
Unifying Your Performance Metrics
A great dashboard does more than just display numbers—it connects the dots. It functions as a central source of truth, much like a broader business metrics dashboard, but is hyper-focused on your search performance.
A truly effective SEO dashboard brings together several key data points to give you the full picture.
Core Components of an SEO Reporting Dashboard
Here’s a breakdown of the essential data points you'll find in any effective SEO dashboard and why each one matters for your strategy.
| Component | Primary Function | Key Metrics |
|---|---|---|
| Visibility | Measures how prominent your brand is in search results. | Keyword Rankings, Search Impressions, Share of Voice |
| Traffic | Tracks the volume and quality of visitors from search. | Organic Sessions, New Users, Top Landing Pages |
| Engagement | Shows how users interact with your site once they arrive. | Bounce Rate, Time on Page, Pages per Session |
| Conversions | Connects SEO activities directly to business goals. | Goal Completions, Conversion Rate, Organic-driven Revenue |
By integrating these different components, an SEO dashboard allows you to graduate from simple data-gathering to genuine strategic management. It gives you the clarity and control to confidently steer your SEO ship, turning abstract numbers into a clear roadmap for real, sustainable growth.
Why an SEO Dashboard Is a Non-Negotiable Tool
Let's move beyond the textbook definition. The real value of an SEO reporting dashboard is how it directly impacts your business. It’s what turns your SEO efforts from a checklist of random tasks into a smart, coordinated strategy that actually produces results you can see and measure.
Think about the old way of doing things. You'd spend hours painstakingly pulling data from Google Analytics, Search Console, your rank tracker, and a half-dozen other tools. It's a tedious, soul-crushing process, and it's shockingly easy to make a mistake. A good dashboard automates all of that, pulling everything you need into one clean, unified view.
This simple change frees up your team to do what they're paid for: analyzing what's happening, spotting trends, and making smart decisions instead of fighting with spreadsheets.
From Complex Data to Clear Communication
One of the toughest parts of any SEO job is explaining your work to people who don't live and breathe it. Try telling a CEO about "crawl budget" or "domain authority," and you'll likely see their eyes glaze over. They care about business growth, not technical jargon.
This is where a dashboard becomes your best friend. It translates all that complex data into a simple, visual story. A line graph showing a steady climb in organic traffic or a pie chart illustrating how your high-value keywords are dominating the search results—that’s a language everyone understands. It turns abstract metrics into hard proof of your return on investment.
A dashboard lets you get ahead of problems instead of just reacting to them. Rather than trying to fix a mess after it’s already hurt your revenue, you can spot the early warning signs and act before it's too late.
With a well-designed dashboard, you can see a dip in rankings for a crucial keyword the moment it happens. You can identify new content ideas from rising search trends and shift your strategy on the fly. Your dashboard should be your command center, giving you actionable insights in much the same way that good embedded analytics for SaaS guides product decisions.
A Driver for ROI and Efficiency
At the end of the day, an SEO dashboard is all about improving your revenue and your team’s workflow. When you have live data right in front of you, you can draw a straight line from your SEO activities to real business outcomes.
- Spotting Ranking Drops: Catch a slide in visibility for your most profitable keywords the day it happens, not a month later when you finally run a report. This allows you to jump in immediately and fix whatever's wrong.
- Identifying Content Gaps: See exactly what your audience is searching for and find the holes in your content strategy. This data-first approach means you’re creating content people actually want and that is built to rank.
- Improving Workflow: A central dashboard becomes the single source of truth for your entire team. Everyone is on the same page, working from the same data, which is essential for getting things done efficiently.
The industry's reliance on these tools is clear when you look at the numbers. The global SEO software market is on track to hit $154.6 billion by 2030, a boom fueled by the absolute necessity for tools that give clear insights into website performance. This trend shows just how vital a quality SEO reporting dashboard has become to stay in the game.
Of course, picking the right platform is everything. The right tool can be the difference between drowning in data and making confident, informed decisions. You can check out some of the best SEO reporting software to see how different platforms, including That's Rank, have features designed to make this entire process simpler and more automated.
Choosing the Right Metrics for Your Dashboard
A powerful SEO dashboard isn't about cramming in as many charts as possible. It's about clarity. A dashboard cluttered with vanity metrics—those numbers that look impressive on the surface but don't actually connect to your business goals—is worse than useless. It just creates noise and can send your entire strategy down the wrong path.
The secret is to choose Key Performance Indicators (KPIs) that tell a clear, meaningful story about what's working and what isn't.
Think of it like the dashboard in your car. You don't need a gauge for the temperature of each individual spark plug. You need to know your speed, your fuel level, and if the engine is overheating. These are the critical data points that inform your decisions on the road. Your SEO dashboard should be built on the same principle: focused, actionable information.
A great way to achieve this is by organizing your metrics into categories that mirror the customer's journey, from their first search to their final action on your site. This framework helps you see the whole picture, not just isolated data points.
Visibility Metrics: Are You Even in the Game?
This is the top of the funnel, and it answers one simple, crucial question: "Are we being seen by our target audience?" Visibility metrics are your first line of defense. They tell you how present your brand is in the search results for the keywords that matter most.
- Keyword Rankings: The classic SEO metric. It tracks your position in search results for specific terms. With a tool like That's Rank, you get daily updates, so you know instantly if your work on "affordable leather sofas" is finally pushing you onto page one.
- Search Impressions: This is simply the number of times your website appeared in search results. Seeing a steady climb in impressions, especially for commercial keywords, is a fantastic sign of growing brand awareness—even before the clicks start pouring in.
If these top-of-funnel numbers start to drop, especially for your high-value keywords, it's a major red flag. It can be a leading indicator of a future dip in traffic and, eventually, sales. Monitoring them lets you react quickly to whatever the competition or Google's latest algorithm update throws at you.
This is why the initial design of a dashboard is so important, as this sketch visualizes. It's about planning for clarity, not just plugging in data.
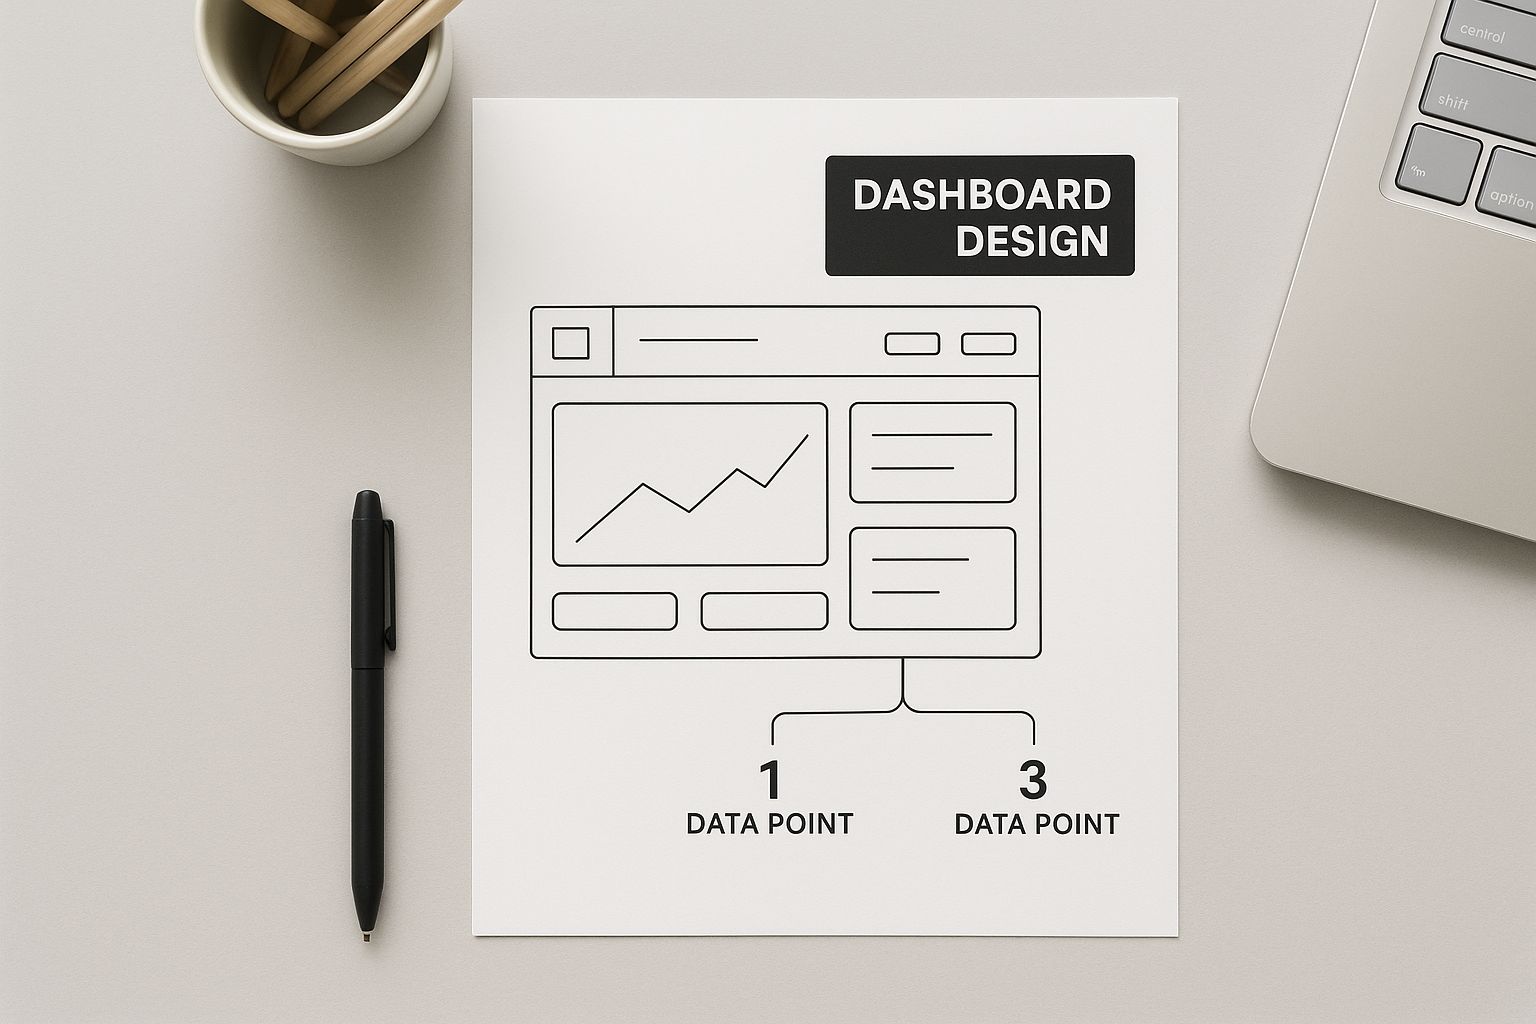 Good dashboard design is a deliberate process focused on function and usability from the very beginning.
Traffic and Engagement Metrics: What Happens After the Click?
Once someone sees you in the search results and decides to click, a new set of metrics takes over. These KPIs tell you about the volume of visitors you're getting and, more importantly, the quality of that traffic. This is where you find out what people actually do once they land on your site.
When choosing these KPIs, it really helps to understand your own site's structure. Knowing the different types of landing pages you're working with—from product detail pages to long-form blog posts—allows you to select more specific and impactful metrics for each one.
An effective dashboard doesn't just spit out numbers; it provides context. It helps you answer the "so what?" behind the data. For instance, high traffic to a blog post is great, but if no one ever clicks through to a related product page, you've identified a missed opportunity.
Let's break down the essential metrics that tell this part of the story.
Key SEO Metrics Breakdown
This table provides a closer look at the essential metrics you'll want to track, what they really measure, and the strategic questions they help you answer.
| Metric Category | Specific Metric | What It Tells You |
|---|---|---|
| Visibility & Discovery | Keyword Rankings | Your position in search results for specific, targeted phrases. Are we visible for what matters? |
| Visibility & Discovery | Search Impressions | How many times your site appeared in search results. Is our brand awareness growing in search? |
| Traffic & Engagement | Organic Sessions | The total number of visits from organic search. Are our SEO efforts driving people to the site? |
| Traffic & Engagement | Top Landing Pages | The pages that receive the most traffic from search. What content is our strongest magnet? |
| Traffic & Engagement | Bounce Rate | The percentage of visitors who leave after viewing only one page. Does our page meet user intent? |
| Traffic & Engagement | Time on Page | How long visitors stay on a specific page. Is our content engaging and valuable to readers? |
| Business Impact | Goal Completions | The total number of desired actions taken. Are visitors doing what we want them to do? |
| Business Impact | Organic Conversion % | The percentage of organic visitors who convert. How effectively does our SEO drive real results? |
These metrics work together to paint a comprehensive picture of performance, guiding you from high-level awareness right down to the bottom line.
Conversion Metrics: The Bottom Line
This is where the rubber meets the road—where your SEO efforts connect directly to real business value. Conversion metrics are what tie your visibility and traffic to tangible outcomes like sales, leads, or new subscribers. Without tracking these, you’re just measuring activity, not results. A true SEO reporting dashboard must close this loop to prove its worth.
The most critical conversion metrics include:
- Goal Completions: This tracks the total number of times users perform a specific action you've defined as valuable—filling out a contact form, downloading an e-book, or, of course, making a purchase.
- Organic Conversion Rate: This is the percentage of your organic visitors who complete one of those goals. It is arguably the single most important metric for demonstrating SEO ROI, as it measures how efficiently you're turning search traffic into business.
By structuring your dashboard around these three core stages—Visibility, Traffic & Engagement, and Conversions—you create a logical narrative. You can easily follow the user's journey from a simple search query all the way to a completed sale. This turns your dashboard from a static data dump into a powerful, strategic tool for growth.
How to Build Your First SEO Dashboard
Putting together your first SEO reporting dashboard sounds intimidating, I get it. But honestly, it’s less about being a tech wizard and more about thinking clearly. The biggest mistake I see people make is jumping straight into a tool and clicking around without any real plan. It's not about being a coding genius; it's about asking the right questions before you drag and drop a single chart.
Think of it this way: you wouldn't build a house without a blueprint. The same goes for your dashboard. Before you even think about connecting data sources, you have to know exactly what you want this dashboard to do. What critical questions does it need to answer for you, your team, or your boss?
Start With Your Objectives
Forget about metrics for a minute. Start with questions. This simple shift in perspective makes all the difference and will guide every decision you make from here on out. Are you trying to show the C-suite that your content efforts are actually making money? Or is your goal to spot technical SEO problems before they tank your rankings?
Here are a few examples to get the gears turning:
- For an Executive: They want the big picture. "How is organic search helping us grow revenue?" This dashboard needs to be clean and simple, highlighting things like organic conversions and traffic value.
- For a Marketing Manager: They're focused on campaign results. "Are we hitting our quarterly goals?" This view would dig a little deeper, tracking keyword ranking changes, which landing pages are winners, and how many leads are coming from search.
- For an SEO Analyst: They live in the weeds. "What’s our site's daily health, and did anything break overnight?" This is a granular, day-to-day dashboard with crawl errors, impression shifts for important keywords, and what the competition is up to.
Once you know your "why," picking the right tools and hooking up your data becomes so much easier.
Choose Your Dashboarding Tool
You don't need a massive budget to build a genuinely useful dashboard. There are fantastic options out there, from powerful and free to enterprise-level platforms.
For most businesses, Google Looker Studio (what used to be called Data Studio) is the absolute best place to start. It’s 100% free, plays nicely with all the other Google tools you already use, and is surprisingly capable. You can pull in your most important data without paying a cent.
Sure, there are more advanced tools like Tableau or Power BI. They offer incredible customization and can handle enormous datasets, which is great for huge companies with complex needs. But for your first dashboard? Looker Studio has everything you need to get the job done right. If you want a deep dive into putting reports together with these tools, you can learn how to create SEO reports that really drive the point home.
Connect Your Core Data Sources
With your objectives set and your tool chosen, it's time to bring in the data. A dashboard is only as good as the information it runs on. For any solid SEO dashboard, you need to connect these two non-negotiable sources:
- Google Search Console (GSC): This is your direct feed from Google itself. It gives you the raw truth on impressions, clicks, click-through rates (CTR), and your average keyword positions. You simply cannot build an SEO dashboard without it.
- Google Analytics 4 (GA4): This tells you what people do after they click through to your site. GA4 tracks organic sessions, how users engage with your content, and, most critically, conversions.
The good news? Connecting these in Looker Studio is a breeze. The platform has built-in "connectors" that link to your accounts with a few clicks, pulling the data right into your workspace.
Visualize Your Data for Clarity
This is the fun part, where your dashboard really starts to take shape. But this isn't just about making things look pretty. It's about picking the right chart to tell a story instantly and clearly.
A chart or graph should communicate its main point in five seconds or less. If someone has to stare at it and squint, you've chosen the wrong visualization.
Here are a few simple rules of thumb for effective visuals:
- Line Charts for Trends: The go-to for showing performance over time. Perfect for tracking organic traffic, impressions, or keyword ranking changes month-over-month.
- Scorecards for KPIs: Use big, bold scorecards for your most important single numbers, like total organic conversions or overall average position. They make your main takeaways impossible to miss.
- Tables for Granular Detail: When you need to show the nitty-gritty, use a table. It's ideal for listing your top-performing pages along with their specific traffic and conversion numbers.
- Pie or Bar Charts for Comparisons: Great for showing proportions. Think of breaking down traffic by device (mobile vs. desktop) or comparing how much of your search traffic is from branded vs. non-branded queries.
By starting with clear goals and following these steps, you'll build more than just a collection of charts. You'll create a powerful strategic tool that helps your business make smarter decisions.
Taking Your Dashboard to the Next Level
Alright, so you’ve built your core SEO dashboard. You're tracking the essentials and have a solid grip on your own performance. Think of it like graduating from a paper map to a reliable GPS—you know where you are and where you're headed. But to truly win the race, you need more than just your own route; you need to see the whole traffic map.
This is where we move beyond simple monitoring and start using the dashboard for a real competitive edge. These advanced strategies turn your reporting tool from a rearview mirror into a strategic command center, helping you anticipate the market's next move and get there first.
Weave in Competitive Analysis
Knowing your own metrics is one thing. Understanding them in the context of your industry is where the magic happens. Without competitive benchmarks, you're flying blind. A 10% bump in organic traffic feels fantastic, but that feeling quickly fades when you discover your main competitor jumped by 30% over the same period.
This is why pulling competitor data directly into your SEO dashboard is a game-changer. Tools like That's Rank are designed for exactly this, letting you track rival keyword rankings right next to your own. Instantly, you can spot:
- Keyword Gaps: See where competitors are ranking that you aren't. This is basically a pre-vetted list of content ideas handed to you on a silver platter.
- Performance Benchmarks: How does your search visibility actually stack up? This helps you set goals that are both ambitious and realistic.
- Strategy Shifts: Did a competitor suddenly rocket up the rankings for a critical term? By seeing this in real-time, you can decode their tactics and quickly adapt your own strategy.
Suddenly, your dashboard stops being a monologue about your own site and becomes a conversation about your place in the market.
Keep a Close Eye on Your Backlink Profile
So much of your search authority is built off-site, primarily through your backlink profile. A top-tier SEO dashboard absolutely has to account for this. Ignoring backlinks is like trying to gauge a company's health by only looking at its marketing materials and never its financials. You need the full story.
Think of backlinks as votes of confidence from other websites. You need to know who is endorsing you and, just as importantly, the quality of their endorsement.
A sudden drop in high-quality backlinks can be an early warning shot, often preceding a dip in rankings. Monitoring your profile lets you react immediately, whether that means reclaiming a lost link or building new ones to shore up your authority.
By integrating backlink metrics into your dashboard, you can track:
- New and Lost Backlinks: Get a heads-up the moment you gain a valuable new link or lose an important one.
- Referring Domain Quality: Keep tabs on the authority of sites linking to you. A handful of links from trusted, authoritative sites will always outweigh hundreds from spammy ones.
- Competitor Link Building: Watch where your rivals are earning new links to get a read on their off-page strategy.
Slice and Dice Your Data with Segmentation
Let's be honest: not all traffic is created equal. Lumping all your data into one big pot is a surefire way to miss critical trends and hidden opportunities. Segmentation is the art of slicing your data into smaller, more meaningful groups to get to the good stuff. It’s the difference between using a magnifying glass and a microscope.
Advanced segmentation in your SEO reporting dashboard allows you to break down performance by:
- Geography: Are you crushing it in the UK but falling flat in Canada? Geographic segmentation helps you tailor your approach for specific regions.
- Device Type: Is your mobile traffic converting at a fraction of your desktop traffic? That’s a massive red flag pointing to a user experience issue that needs fixing, fast.
- User Demographics: Dig into performance by age, gender, or other audience characteristics to seriously refine your content and targeting.
This level of detail moves you beyond broad, fuzzy observations to pinpointing specific, actionable fixes that can make a huge difference.
Start Forecasting Performance with Your Data
Finally, the most forward-thinking dashboards don't just look back—they help you look ahead. A dashboard loaded with months or years of your performance data is an incredibly powerful forecasting tool. By analyzing historical trends, you can create surprisingly accurate projections for future traffic and conversions.
This isn't about gazing into a crystal ball; it's about making informed, data-driven decisions to set achievable goals and allocate your resources wisely. For instance, if your data consistently shows a 15% traffic lift every quarter following a major content push, you can forecast similar growth for your next campaign with a high degree of confidence. This transforms your SEO planning from hopeful guesswork into a data-backed strategy.
Common Dashboard Mistakes and How to Avoid Them

It’s easy to think of an SEO reporting dashboard as a "set it and forget it" tool. But that's a recipe for disaster. Dashboards need thoughtful setup and a bit of ongoing maintenance to be worth anything. Without that attention, even the most powerful platform can turn into a digital dust collector, completely ignored by the very people it was built to help.
One of the biggest traps we see people fall into is vanity metric overload. This is when a dashboard gets crammed with numbers that look impressive on the surface but offer zero real strategic value. Think tracking thousands of obscure keywords that nobody is actually searching for. It creates a dangerous illusion of progress while completely burying the real story your data is trying to tell you.
Another classic mistake is just throwing data onto the screen without any context. A chart showing a dip in traffic is just a scary-looking line unless you can answer why it happened. Was it a Google algorithm update? A seasonal slump? A technical glitch on the site? Data without the "so what?" is just noise.
Steering Clear of Common Pitfalls
Avoiding these mistakes really boils down to having clear goals and a bit of discipline. The point isn't to show every metric you can possibly track; it's to shine a spotlight on the ones that actually help you make smart decisions. A clean, focused dashboard will always be more powerful than a cluttered one.
Here’s how to keep your SEO dashboard valuable and effective:
- Stick to Actionable KPIs: Every single chart on your dashboard should help answer a specific business question. If a metric doesn't point toward a potential action or decision, it probably doesn't belong there.
- Provide Much-Needed Context: Use annotations to mark important events. Add a note when a big content campaign went live, when a site migration happened, or when Google rolled out an update. This transforms your dashboard from a simple report into a historical record that explains the why behind performance shifts.
- Maintain Good Data Hygiene: You have to be able to trust your numbers. Regularly audit your data sources and tracking setups. Make sure your conversion goals are firing correctly and that you're filtering out internal and bot traffic. Accurate data is the foundation of everything.
The real purpose of an SEO reporting dashboard is to simplify complexity, not add to it. A great dashboard is one a stakeholder can glance at and understand in less than a minute, getting a clear picture of performance without needing a data scientist to translate.
The demand for these kinds of clear insights is a big reason why the SEO software industry is growing so fast. North America currently leads the pack, and the U.S. market alone, valued at $23.69 billion, is expected to hit $75.05 billion by 2034, as more businesses double down on organic search. Dashboards are the analytical backbone driving that growth. You can read more about this trend in this global market report.
Setting a Cadence for Review
Finally, remember that a dashboard only works if people actually look at it. You need to build a routine around it. A quick daily check can help you spot technical problems before they spiral. A weekly review is perfect for tracking campaign progress, and a monthly meeting can get everyone aligned on high-level strategy. This simple cadence is what turns a dashboard from a report into a central, trusted tool for making decisions.
For a deeper dive, agencies can find more specific advice in our guide to SEO reporting tools for agencies.
Frequently Asked Questions
When you start digging into SEO analytics, a few common questions always pop up. Let's clear the air and give you some straightforward answers about getting the most out of an SEO reporting dashboard.
What's the Difference Between a Report and a Dashboard?
It helps to think of it this way: a traditional SEO report is like a photograph. It’s a static picture of your performance over a specific time, like last quarter or last month. It's usually a PDF that lands in your inbox, telling you what happened.
An SEO reporting dashboard, on the other hand, is like a live video feed. It’s dynamic and interactive, often updating close to real-time. You don't just see the "what"; you can click, filter, and dig deeper to understand the why. It’s where you go for immediate analysis and to spot trends as they emerge.
How Often Should I Check My Dashboard?
Honestly, there's no single right answer—it all comes down to your role and what you're responsible for. But here’s a good rule of thumb to get you started:
- SEO Specialists: You’re in the trenches, so a daily check-in is a good idea. You’ll be the first to spot any sudden technical hiccups, big algorithm shifts, or ranking drops on your most important keywords.
- Marketing Managers: A weekly look is usually enough to see how you're tracking against your campaign goals and monitor overall traffic patterns.
- Business Owners or Executives: A quick glance at a high-level dashboard every couple of weeks, or even monthly, is perfect for keeping an eye on the big picture—the return you're getting from organic search.
The real key is consistency. Find a rhythm that works for you. This will help you learn what normal ups and downs look like, so you don't panic over minor data blips but can still catch major issues early on.
Can I Build an SEO Dashboard for Free?
Yes, you absolutely can. It's entirely possible to build a powerful and incredibly useful SEO dashboard without spending any money at all.
Tools like Google's Looker Studio are completely free and designed to work perfectly with other free Google tools you’re already using. You can pull in your Google Analytics 4 and Google Search Console data at no cost. Sure, paid platforms might offer fancier features or more automation, but you can build a highly effective dashboard with just the free resources, putting data-driven SEO within reach for any business.
Ready to stop guessing and start knowing? That's Rank provides a powerful, all-in-one SEO reporting dashboard that simplifies your entire process. Track rankings, audit your site, and monitor competitors with ease. Start making data-driven decisions today with your free That's Rank account.