Picture this: you have an analyst who works around the clock, pulling data, cleaning it up, and crafting perfect, insightful reports 24/7. They never get tired, never take a break, and never make a mistake. That, in essence, is automated report generation. It’s a process that turns raw, messy data into polished, actionable intelligence on its own, freeing up your team to think strategically instead of getting bogged down in manual tasks.
What Is Automated Report Generation?
Simply put, automated report generation uses software to automatically collect data from different sources, arrange it into a format you’ve already defined, and then send it out to the right people. Think of it like building a smart, repeatable assembly line for your business intelligence. Instead of manually exporting spreadsheets, copying and pasting data, and fiddling with charts every single week, you design the process once and let the system run on its own schedule.
This is about more than just saving a few hours. It's about establishing a single, reliable source of truth for your entire organization. We’ve all seen it happen—manual reporting is a breeding ground for human error. A misplaced decimal point, an incorrect formula, or a simple copy-paste mistake can snowball into disastrously flawed business decisions. Automation all but eliminates these risks, delivering consistent and accurate information every single time a report is generated.
The Engine Behind the Automation
This isn't magic; it's a practical application of a broader field called intelligent automation, which blends technologies like AI and machine learning to tackle complex business processes. And businesses are catching on fast. The global intelligent automation market was valued at around $10.6 billion in 2021 and is on track to explode to nearly $51.58 billion by 2033. This incredible growth shows a clear shift: companies are investing heavily in systems that automate tasks like reporting to make smarter, faster decisions.
When you automate routine reporting, you don't just get your data faster; you get better data. This frees up your skilled analysts to do what they do best: interpret the insights and shape business strategy. That’s where their real value is.
From Raw Data to Actionable Insights
So, how does it actually work? An automated reporting tool connects directly to your data sources—whether that's a database, a CRM like Salesforce, a marketing platform like Google Analytics, or a project management tool. Once connected, the tool follows a specific set of rules that you create.
These rules tell the system exactly what to do:
- Data Extraction: Pinpoint and pull specific metrics, like daily sales figures or website traffic from the last 30 days.
- Data Transformation: Clean up the information by standardizing date formats, removing duplicate entries, or calculating new metrics.
- Data Visualization: Turn the numbers into easy-to-digest charts, graphs, and tables that tell a clear story.
- Scheduled Distribution: Automatically email the finished report to the executive team every Monday at 9 AM sharp.
A great example is a project team that needs regular updates on task progress and potential roadblocks. While this guide covers the topic broadly, a detailed look at generating reports in Jira shows a perfect real-world application. It’s a fantastic illustration of how automation can transform complex project data into simple, recurring status updates without anyone lifting a finger.
Core Components of an Automated Reporting System
To really understand how this all fits together, it helps to break down the system into its core components. Each piece plays a crucial role in turning raw information into a valuable business asset.
| Component | Function | Business Impact |
|---|---|---|
| Data Connectors | Establish a direct link to various data sources (databases, APIs, SaaS tools). | Ensures data is fresh and comprehensive without manual exporting. |
| ETL Engine | Extracts data, transforms it (cleans, aggregates), and loads it into a report. | Guarantees data is consistent, accurate, and ready for analysis. |
| Report Designer | A user interface for creating report templates with charts, tables, and text. | Allows you to customize the look and feel of reports for different audiences. |
| Scheduling & Distribution | A scheduler that runs reports at set times and a system to send them out. | Delivers timely insights directly to stakeholders via email, Slack, or other channels. |
Ultimately, these components work in concert to create a seamless flow from data collection to decision-making, forming the backbone of any effective automated reporting strategy.
Why Automating Your Reporting Is a Game Changer

Switching from manual spreadsheets to automated report generation isn't just a minor upgrade—it fundamentally changes how your business operates. Think of it like swapping an old, hand-drawn map for a real-time GPS. Sure, the map might get you to your destination eventually, but the GPS reroutes you around traffic, finds clever shortcuts, and gives you a precise arrival time. It lets you focus on the journey, not just the directions.
The first thing you'll notice is a huge leap in data accuracy. Manual reporting is a minefield of potential human errors. One simple typo or a misplaced formula can skew your entire analysis, leading you to make decisions based on faulty information. Automated systems, on the other hand, pull data directly from the source. This eliminates the risky copy-and-paste dance and guarantees your decisions are built on truth, not typos.
This newfound reliability fosters a culture of trust. When everyone in your organization is working from the same set of consistent, accurate reports, the pointless arguments over "whose numbers are right" simply vanish. Instead, your teams can have productive conversations about what the data is actually telling them and decide on the best way forward.
Reclaiming Your Most Valuable Asset: Time
The amount of time you get back is truly staggering. Imagine a marketing manager who spends five hours every single week pulling performance data from Google Analytics, various social media platforms, and different ad networks. That adds up to over 250 hours a year just on grunt work—time that could be spent brainstorming creative campaigns or digging into strategic analysis.
By eliminating manual reporting, organizations don't just save time; they reinvest it. Skilled employees are freed from monotonous tasks to focus on strategic initiatives that drive growth, a shift that provides a significant competitive advantage.
This shift empowers your best people to do what they do best. They stop being data janitors and become data strategists, spotting trends and uncovering opportunities that were once buried under a mountain of administrative tasks.
Achieving Consistency and Compliance
Automated systems enforce a level of discipline that's nearly impossible to maintain manually. Reports are generated and sent out on a predictable schedule, so stakeholders always have the information they need, right when they need it. This kind of reliability is absolutely crucial for meeting regulatory requirements or fulfilling contractual obligations.
A financial services firm, for example, can schedule automated compliance reports to be generated and archived every day. This creates a flawless audit trail without any last-minute panic to meet a deadline. It’s a proactive approach that minimizes risk and keeps things running smoothly.
The benefits of automated report generation ripple through every department:
- Operations teams can keep a close eye on inventory with daily updates, preventing costly stockouts.
- Sales departments get instant access to their pipeline data, which helps them create much more accurate forecasts.
- Marketing agencies can give their clients polished, professional performance reports without the manual headache.
Ultimately, automating your reports helps your entire organization move from being reactive to proactive. It creates a solid foundation of accurate data, frees up your team for more important work, and establishes a rhythm of reliable insights that leads to better, faster decisions.
How Automated Reporting Works From Start To Finish
So, how does automated reporting actually work? It can seem a bit like a black box at first, but when you pull back the curtain, it's a surprisingly logical five-step process. Think of it as an assembly line for your data—it takes in raw, messy numbers from all over the place and turns them into a polished, insightful report that lands exactly where it needs to, right on time.
Let's walk through each stage of that journey, from initial idea to final delivery.
Stage 1: Defining Your North Star
Before you touch a single piece of software, you have to know what you're trying to achieve. This first step is all about setting clear goals. What story do you need your data to tell? Are you tracking daily sales performance, watching how users interact with your website, or keeping tabs on critical project deadlines?
These objectives become your "north star," guiding every decision you make down the line. Without well-defined key performance indicators (KPIs), you'll end up with a report full of random numbers that don't mean anything. You have to pinpoint the metrics that genuinely matter to your business's health and growth.
Stage 2: Connecting the Data Pipelines
Okay, you know what you need to measure. Now, where does that information live? For most businesses, it's scattered everywhere: in a CRM, Google Analytics, a project management tool, or even a collection of spreadsheets. The second stage is all about tapping into these sources.
Modern automation tools use things like data connectors and APIs to build a direct pipeline from these systems into your reporting tool. This is a game-changer because it completely gets rid of the soul-crushing task of manually exporting and importing files. It also means your reports are always fed with the freshest, most current data. If you want to get into the nitty-gritty of this, our guide on automating data collection is a great place to start.
Here’s a simple visual of how the data flows from collection to final distribution.
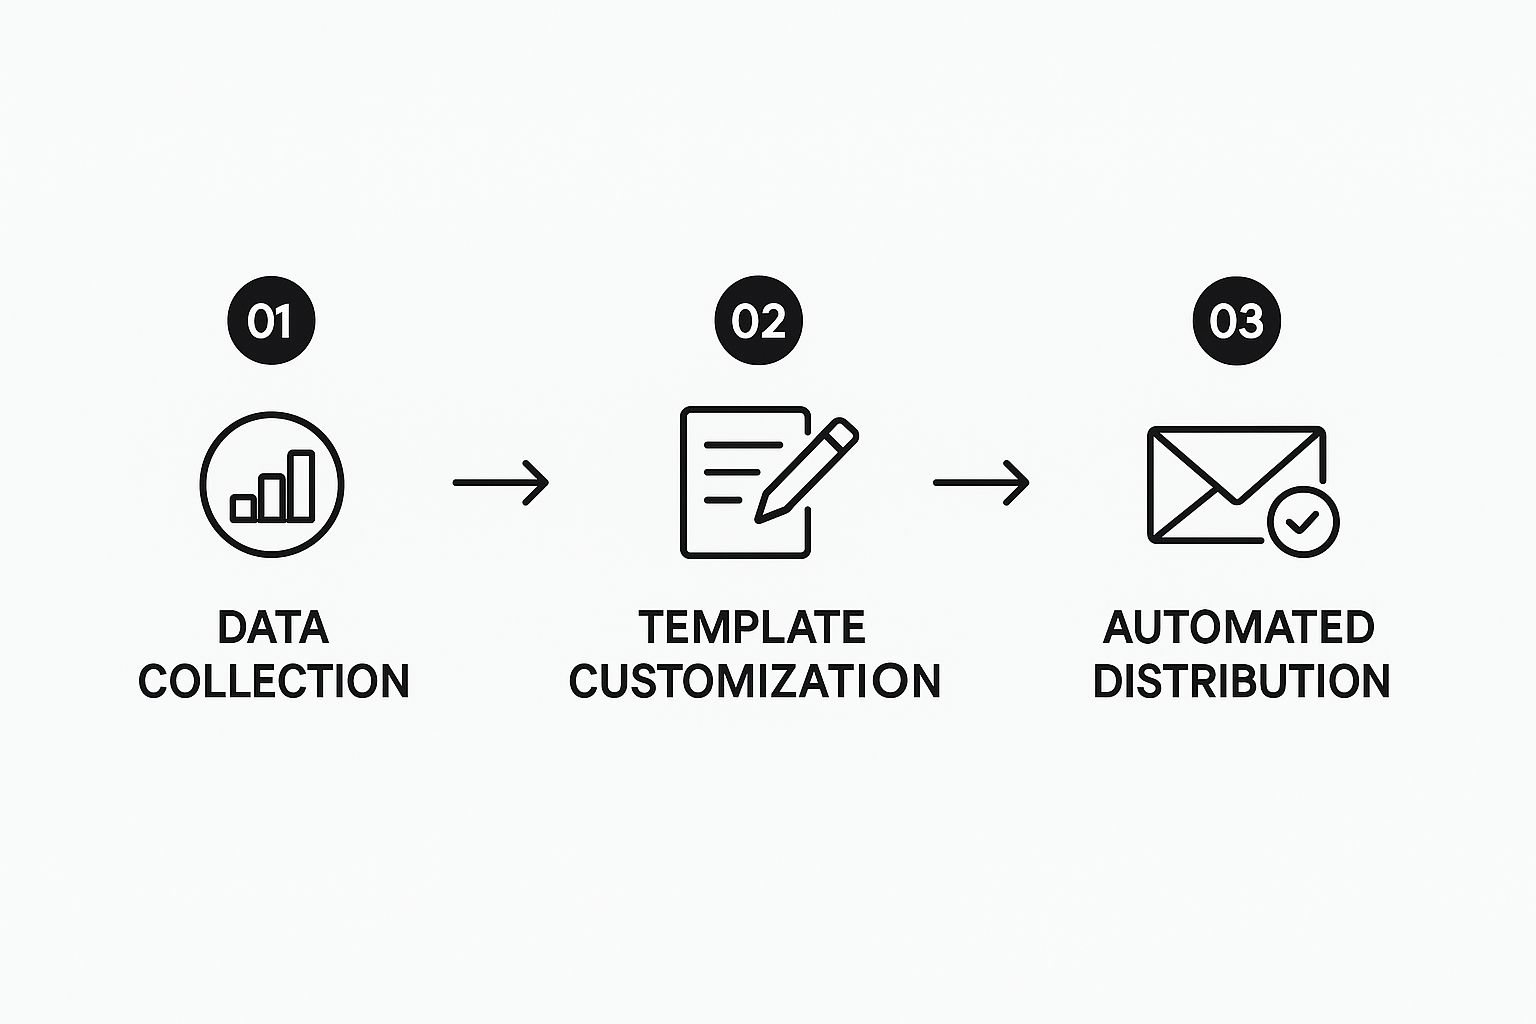
As you can see, it’s a smooth, hands-off progression from gathering the raw data, applying a template, and then sending out the finished report.
Stage 3: The Great Data Cleanup
Let's be honest: raw data is usually a mess. It’s often full of duplicates, missing fields, and formatting inconsistencies—what people in the industry call "dirty" data. This stage is where you bring in the cleanup crew, a process often referred to as ETL (Extract, Transform, Load).
First, the system extracts the data from your sources. Then, it transforms it by cleaning it up—maybe it standardizes all dates into a MM/DD/YYYY format or combines raw sales numbers to calculate a new metric like "average order value." Finally, it loads this pristine data into the reporting tool. This step is absolutely critical for ensuring your reports are built on a foundation of truth.
Stage 4: Crafting the Story
Now for the fun part. With clean, reliable data at your fingertips, you can start thinking about how to present it. This is where you transform those numbers into a visual story that people can understand at a glance. A massive table of numbers is intimidating; a sharp, clear chart makes the key takeaway obvious.
Most tools offer a drag-and-drop interface where you can:
- Pick your visuals: Choose the bar charts, line graphs, and pie charts that best tell your story.
- Arrange the layout: Put the most important information front and center.
- Add helpful context: Use titles, labels, and short descriptions to explain what the charts actually mean.
Stage 5: Setting It on Autopilot
This is the moment it all comes together. You've set your goals, connected your data sources, cleaned everything up, and designed a beautiful report. Now, you get to put the whole system on autopilot.
You can schedule your report to run automatically on any cadence you need—daily, weekly, or monthly. The system will then handle all the previous steps on its own and deliver the finished product to your stakeholders through email, a Slack channel, or a shared dashboard. This is the "set it and forget it" payoff that frees you from the tedious grind of manual reporting.
This final step is getting even smarter with technologies like Retrieval-Augmented Generation (RAG). The market for RAG was valued at around USD 1.2 billion in 2024 and is expected to rocket to USD 11.0 billion by 2030. This shows just how much is being invested in AI that can pull real-time data and write accurate, context-aware summaries for reports. You can read more about this explosive growth on Grand View Research.
Choosing the Right Automated Reporting Tools

Picking the right software for your automated report generation needs can feel a bit like navigating a maze. There are countless options out there, all promising to be the perfect solution, and it’s easy to get lost. The secret is knowing that these tools really fall into a few distinct categories, each built for a different job and a different kind of user.
Think of it like choosing a vehicle. You wouldn't buy a sports car to haul lumber, and you wouldn't use a semi-truck for your daily commute. In the same way, the right reporting tool depends entirely on your specific destination—your business goals, technical skills, and budget.
Let’s break down the main types to help you find the perfect fit for the road ahead.
Powerful Business Intelligence Platforms
First up are the heavy hitters: Business Intelligence (BI) platforms. I'm talking about tools like Tableau, Microsoft Power BI, or Looker Studio. These are the all-in-one command centers for your data. They’re designed for deep, exploratory analysis and can connect to just about any data source you can imagine, from complex databases to simple cloud apps.
BI platforms are fantastic for creating interactive dashboards that let people click, drill down, and discover insights for themselves. This makes them ideal for larger organizations with dedicated data analysts who need to answer complex business questions. Their main strength is their sheer power and flexibility. But that power can also be their biggest drawback—they often come with a steeper learning curve and a higher price tag.
Dedicated Reporting Engines
Next, we have dedicated reporting engines. Tools like Crystal Reports or SQL Server Reporting Services (SSRS) are the true workhorses of the reporting world. They are built for one primary job: producing pixel-perfect, highly structured reports. Think of things like financial statements, invoices, or detailed operational summaries that have to follow a very rigid format.
These tools are less about interactive exploration and much more about generating precise, static documents on a recurring schedule.
- Best For: Generating formatted operational reports like invoices, compliance documents, and financial statements.
- Key Strength: Unmatched control over report layout and formatting, which guarantees consistency.
- Potential Limitation: Less flexible for on-the-fly analysis and often requires technical skills (like SQL) to build the reports.
Built-in Reporting Tools
Finally, many of the platforms you already use every day have their own built-in reporting features. Your CRM, your ERP software, or even specialized marketing tools offer convenient, out-of-the-box reporting. For marketing teams, a purpose-built tool is often the most direct path to valuable insights. If that sounds like your situation, you can check out our guide on the best SEO reporting software to see how these specialized tools can simplify your workflow.
These built-in options are incredibly convenient because the data is already there, and the reports are designed to measure what the platform does best.
The primary advantage of using a built-in tool is its simplicity and immediate relevance. It's tailored to the platform's data, eliminating complex setup and providing instant value without the need for a separate, costly system.
While they're fantastic for monitoring activities within that specific system, they can become limiting when you need to pull data from multiple sources to get the full picture of your business.
Comparison of Automated Reporting Tool Types
To help you decide, here’s a quick comparison of how these tool categories stack up. This table offers a comparative look at different categories of reporting tools to help you choose the right solution for your business.
| Tool Category | Best For | Key Strengths | Potential Limitations |
|---|---|---|---|
| Business Intelligence | Deep, cross-functional data analysis and interactive dashboards. | High flexibility, powerful visualizations, connects to anything. | High cost, steep learning curve, can be overkill for simple needs. |
| Dedicated Engines | Producing highly formatted, pixel-perfect operational reports. | Precision layout control, ideal for structured documents. | Rigid, less user-friendly, often requires technical expertise. |
| Built-in Tools | Quick, platform-specific insights without needing a separate system. | Easy to use, no extra cost, perfectly aligned with the platform's data. | Limited to a single data source, poor cross-functional visibility. |
Ultimately, choosing the right tool is a balancing act between your team's needs, their technical abilities, and your budget. By understanding these core categories, you can narrow your focus and select a solution that will truly support your automated report generation strategy and drive smarter decision-making.
Critical Best Practices for a Smooth Rollout
https://www.youtube.com/embed/XIaRHMDHzSA
Getting a powerful tool up and running is only half the battle. The real win comes from making sure your team actually uses it and gets value from it. Rolling out automated report generation needs a smart strategy to sidestep common issues and ensure you actually see a return on your investment. A messy launch can lead to low adoption, jumbled data, and reports that no one trusts or even looks at.
Think of it like building a house. You wouldn't just start throwing up walls without a solid foundation and a clear blueprint, right? A successful software implementation demands that same level of planning to make sure what you build is sturdy, useful, and actually serves everyone’s needs.
Start Small with a Pilot Project
Instead of trying to launch this across the entire company all at once, start with a focused pilot project. Pick one department or even a single, high-value report to automate first. This approach keeps the risk low and lets you create a solid proof-of-concept.
By starting small, you can:
- Work out technical kinks in a low-stakes setting.
- Demonstrate clear value quickly to build momentum and get leadership on board.
- Gather feedback from a small group of users to iron out the process before a wider rollout.
This first win becomes your internal case study. It makes it a whole lot easier to get other departments excited about making the switch.
A successful pilot project isn't just about testing the technology; it's about proving the concept. When other teams see the time saved and insights gained, they won't need convincing—they'll be asking to be next.
Involve Stakeholders from the Start
Never, ever build reports in a vacuum. The people who will actually use them every day—from marketing and sales to operations and finance—are your most critical asset. Pull them into the process early to figure out which metrics truly matter for their roles.
When stakeholders have a say in designing the reports, they feel a sense of ownership. This teamwork ensures the final report is genuinely helpful and relevant, not just a bunch of numbers that looks pretty to the person who built it. For agencies, this collaboration is absolutely essential, and finding the right SEO reporting tools for agencies that make this easy is a game-changer for client happiness.
Prioritize Data Governance Immediately
You've heard it before: "garbage in, garbage out." It's the absolute truth when it comes to automated reporting. Your new, sophisticated system is useless if it's running on inaccurate, inconsistent, or incomplete data. You have to establish clear data governance rules from day one.
This means defining things like:
- Who owns which data sets?
- What are the standards for data entry and formatting?
- How will data quality be checked and maintained over time?
This discipline is what makes the insights from your automated reports trustworthy and reliable. This focus on process is why the workflow automation market, valued at USD 21.51 billion in 2024, is projected to hit USD 37.45 billion by 2030. Companies are investing big in tech that cleans up data handling and reporting. You can dig deeper into these trends and the major players at Mordor Intelligence.
Finally, don't skimp on training. It's not enough to show your team where to find the reports; you need to teach them how to read and interpret the data. Good training turns a simple software rollout into a real capability boost for your whole organization, making your investment a true success.
The Future Is Predictive, Not Just Retrospective

We're at a fascinating turning point in the evolution of business reporting. For years, reports have been all about looking backward—giving us a clear picture of what already happened. While that’s absolutely essential, the real power lies in using that data to see what’s coming. The future of automated report generation isn't just about efficiency; it's about making reports predictive and turning them into intelligent tools that can anticipate what's around the corner.
This major leap is being fueled by artificial intelligence and machine learning. Think about a reporting system that doesn't just show you last quarter's sales figures but also projects the next quarter's results with a startling degree of accuracy. It’s like upgrading from only having a rearview mirror to having a smart GPS that not only shows your current location but also maps out the road ahead, warning you about traffic jams before you hit them.
Moving Beyond Summaries to Storytelling
The next wave of automated reports won't just spit out data; they’ll interpret it for you. By using Natural Language Generation (NLG), these systems can actually write clear, human-like summaries that explain what the numbers really mean. This is a game-changer for making data useful to everyone in the company, not just the data analysts.
So, instead of a manager squinting at a complex chart, they might get a report with a simple paragraph that says, "Sales in the Northeast are projected to dip 15% next month due to seasonal trends, but we expect a 20% surge in the West thanks to the recent marketing campaign." That automated context instantly turns raw data into a story you can act on.
The ultimate goal is to move from data reporting to data storytelling. When systems can automatically find the narrative within the numbers, they empower leaders at all levels to make faster, more confident decisions without needing a data science degree.
The Rise of Conversational Analytics
Another exciting development is the move toward what's often called conversational analytics. This is true self-service BI, where anyone can ask complex questions about their data in plain English and get an immediate, visual answer.
It’s almost like having a conversation with your data.
- An operations manager could just type, "Show me our top 5 underperforming production lines this month."
- A marketing head could ask, "Which ad campaigns drove the most conversions last week?"
The system would instantly generate the right chart or table. This completely removes the final barrier between a business user and the insights they need.
By adopting automated report generation today, you’re laying the groundwork for this intelligent future. Mastering automation now is how you prepare your business for a world where decisions aren't just data-driven, but predictive, proactive, and genuinely insightful.
Of course. Here is the rewritten section, designed to sound completely human-written and natural, following all your specified requirements.
Your Automated Reporting Questions, Answered
Jumping into automated reporting naturally brings up some practical questions. You're probably wondering about the cost, how your data will be protected, and just how much technical know-how you'll need. Let's walk through these common concerns one by one.
What's the Real Cost to My Business?
There’s no single price tag, which is actually a good thing. The cost really depends on what you need. You can find affordable monthly subscriptions perfect for a small team, or you can invest in a more robust system for an entire enterprise.
When you're budgeting, think beyond the software license. Factor in any one-time setup fees and potential ongoing costs for training or premium support. A great way to start is by picking a smaller, high-impact project. This keeps initial costs down and lets you demonstrate the value before going all-in.
Can I Trust It With My Sensitive Business Data?
Security is a huge deal, and reputable reporting tools treat it that way. They don't just bolt on security features as an afterthought; it's baked into their very design.
You'll find critical features like:
- Role-based access, which ensures people only see the data they're supposed to.
- End-to-end data encryption to protect information whether it's being sent or just sitting on a server.
Plus, these systems keep detailed audit logs, so there's always a record of who did what and when. This level of security is non-negotiable for any quality platform.
Your data's safety is not an afterthought in a quality automated reporting system; it is a foundational component of its design, ensuring that powerful insights don't come at the expense of security.
Do I Need to Be an IT Guru to Set This Up?
Not necessarily. Many of today's best tools are built for business users, not just tech experts. They often have intuitive drag-and-drop interfaces that let you build reports without writing a single line of code.
Sure, if you're trying to connect to a really old or complex internal database, you might need to loop in your IT team for a bit of help. But for the most part, individual teams can get up and running on their own, creating the exact reports they need without getting stuck in a long IT queue.
Ready to stop guessing and start tracking your SEO performance with precision? That's Rank offers automated alerts, white-label reporting, and comprehensive competitor insights to drive organic growth. Get started for free and see what you've been missing.