If you can't measure your marketing, you can't improve it. But effective measurement isn't just about tracking clicks and likes. It's about connecting every single marketing action—from a new blog post to a pricey ad campaign—directly to a meaningful business outcome.
Defining What Success Actually Looks Like

So many marketing initiatives fall flat at the final hurdle. Not because the creative was bad or the execution was sloppy, but because no one defined what "success" was supposed to look like in the first place. Before you spend a dime or write a single word of copy, you have to be crystal clear on what you're trying to accomplish.
It’s easy to get caught up in the whirlwind of activity, chasing surface-level numbers that feel good but don’t really move the needle. True effectiveness is measured by business results, not just marketing busywork. Without a clear target, you're just collecting data points, not generating actionable intelligence.
From Business Goals to Marketing Objectives
The first, most crucial step is to break down your company's big-picture goals into smaller, tangible marketing objectives. Think of it this way: a business goal is the destination the company wants to reach, while a marketing objective is the specific turn-by-turn direction your team will follow to help get there.
For instance, a broad business goal like "Increase company revenue by 20%" is a great start, but it’s not something a marketer can act on directly. A much better marketing objective would be, "Generate 500 new Marketing Qualified Leads (MQLs) from organic search this quarter."
Suddenly, your work has a clear purpose. That blog post isn't just for page views anymore; it's a strategic asset designed to capture qualified leads. This simple shift ensures your daily efforts are always tied to what the C-suite actually cares about.
"How do you know if your marketing campaigns are working? The way to ensure this is to have the right metrics to measure your performance. At the simplest level, you need to measure what you set out to achieve with your marketing objectives." — Sunil Gupta, Harvard Business School Professor
To make this connection even clearer, here’s how you can translate common business goals into specific marketing objectives and the metrics you'd use to track them.
From Business Goals to Actionable Marketing Objectives
| Business Goal | Marketing Objective | Example Key Metric |
|---|---|---|
| Increase Market Share | Boost brand visibility in a new demographic. | Share of Voice (SOV) |
| Improve Profitability | Lower the cost to acquire a new customer. | Customer Acquisition Cost (CAC) |
| Grow Revenue by 25% | Increase the average purchase value. | Average Order Value (AOV) |
| Enhance Customer Loyalty | Improve customer retention over the next year. | Customer Churn Rate |
This framework helps bridge the gap between high-level strategy and day-to-day execution, ensuring your marketing activities are always pulling in the right direction.
Aligning Objectives with the Marketing Funnel
Your objectives also need to reflect the customer's journey. Not every campaign is built for an immediate sale. Some are designed to plant a seed, while others are meant to nurture a budding relationship.
Mapping your goals to the different stages of the marketing funnel helps you measure the right things at the right time.
- Top of Funnel (Awareness): The main job here is to get your brand on the radar of new people. Instead of looking at sales, you’d track metrics like brand search volume, social media reach, or traffic from new users.
- Middle of Funnel (Consideration): At this stage, prospects know who you are and are weighing their options. Your objectives should focus on engagement, like increasing newsletter sign-ups, scheduling demo requests, or seeing more time spent on key product pages.
- Bottom of Funnel (Decision): This is where the magic happens—the conversion. Objectives here are tied directly to the bottom line, such as improving customer acquisition cost (CAC), driving more online sales, or boosting return on ad spend (ROAS).
By setting stage-specific goals, you get a much more sophisticated and accurate view of what’s working. A campaign that looks like a dud on the sales front might actually be a massive success at building top-of-funnel awareness that will pay off for months to come. Getting this foundational step right is what separates wasted effort from focused, impactful marketing.
Choosing Metrics That Truly Matter
Once your objectives are crystal clear, it’s time to pick the Key Performance Indicators (KPIs) that actually show you’re making an impact. This is a classic stumbling block. It's so easy to get mesmerized by vanity metrics—things like social media likes or a spike in page views. They look great on a chart, but they rarely tell you if your marketing is moving the needle on what matters: the bottom line.
The real goal here is to choose metrics you can act on. Think of your KPIs as a compass. They should tell you, at a glance, whether you’re on the right path to hitting your goals or if you’ve started to drift. A solid set of KPIs is what separates marketing that just feels busy from marketing that demonstrably grows the business.
Connecting Metrics to Goals and Channels
The right KPIs are completely dependent on your specific goals and the marketing channel you're using. You wouldn't judge a fish on its ability to climb a tree, right? In the same way, don't judge a brand awareness campaign by its direct sales figures. Context is everything.
Let's look at a couple of real-world examples:
- If you're running a content marketing campaign to generate leads, you should be laser-focused on metrics like new email subscribers from blog posts, organic traffic to high-intent pages, and the conversion rates on your downloadable guides or webinars.
- For a paid social media campaign designed for immediate sales, the most critical numbers are your Return on Ad Spend (ROAS), Customer Acquisition Cost (CAC), and the conversion rate from ad clicks to purchases.
Every channel has its unique strengths, and that demands a tailored way of measuring success. For instance, judging SEO success goes way beyond just tracking rankings. Our guide on https://www.thatisrank.com/articles/how-to-measure-seo-success explains how to track valuable organic conversions and traffic quality. Similarly, if you're working with influencers, you need to look past simple engagement and focus on specific key performance indicators (KPIs) for influencer marketing like referral traffic and shifts in audience sentiment.
Building a Balanced Scorecard
To get the full picture, I always recommend building a balanced scorecard that covers the entire customer journey. This means picking a few core KPIs for each stage: acquisition, engagement, and retention.
- Acquisition Metrics: How are you bringing new people in? Think Cost Per Lead (CPL), MQL-to-SQL conversion rate, and traffic from specific channels.
- Engagement Metrics: What are people doing once they find you? Look at session duration, conversion rates on key pages (like demo requests or pricing page visits), and email click-through rates.
- Retention Metrics: Are your customers staying with you? Here, you’ll want to track Customer Lifetime Value (CLV), churn rate, and your repeat purchase rate.
This method keeps you from getting tunnel vision on one part of the funnel while another is leaking.
The most common pitfall I see is 'KPI overload.' Teams track dozens of metrics and end up paralyzed by all the data. Force yourself to choose the vital few KPIs that link directly to your main business objectives. The goal is focus, clarity, and, most importantly, action.
Getting your measurement framework right is a huge differentiator. A recent BCG study involving 3,000 marketing leaders revealed that top-performing organizations see up to 70% higher revenue growth simply by using standardized KPI frameworks. It's a testament to the fact that even with all the talk about AI, strong fundamentals are irreplaceable. The study also noted that a third of marketers still struggle to measure cross-channel effectiveness, showing there's still a big opportunity for those who get it right.
Building Your Measurement Tech Stack
Great KPIs are one thing, but tracking them reliably? That comes down to your technology. Your marketing tech stack is the engine that actually powers your entire measurement framework. Without the right tools working together, you end up with data silos—just isolated pockets of information that can't possibly give you the full picture of what’s working.
You don't need to chase every shiny new tool that hits the market. The real goal is to build a smart, curated stack. You want a set of tools that can collect data from every touchpoint in the customer journey, all the way from that first ad click to the final sale and even repeat purchases. This is how you get that unified view you need to truly measure your marketing's impact.
Core Components of a Measurement Stack
For most businesses, a rock-solid measurement foundation can be built with just a handful of essential tools. Think of these as the non-negotiables for tracking performance from start to finish.
Your core stack will almost always include:
- Web Analytics: This is ground zero for understanding everything happening on your website. Google Analytics 4 (GA4) is the industry standard here, offering incredible depth on how people find you and what they do once they're on your site.
- Customer Relationship Management (CRM): This is where you connect marketing efforts to business results. A CRM like HubSpot or Salesforce tracks the entire customer lifecycle, finally linking that campaign you ran last quarter to the revenue it generated this month.
- Platform-Specific Analytics: Every channel has its own data story to tell. I'm talking about the native analytics inside Google Ads, Meta Ads Manager, and LinkedIn Campaign Manager. These platforms give you the nitty-gritty details on ad performance, audience engagement, and campaign conversions.
The real magic, though, happens when you get these tools talking to each other. When you integrate your CRM with your web analytics, for instance, you can finally see not just which campaign drove a lead, but what the lifetime value of that customer eventually became.
A mistake I see all the time is people treating each tool as a separate report. The power isn't in the individual reports; it's in creating a single source of truth where data from every platform flows together. That’s how you graduate from looking at siloed channel metrics to understanding your total marketing impact.
Ensuring Data Integrity and Clean Attribution
A tech stack is only as good as the data you feed it. If your data is messy or inaccurate, you'll make bad decisions based on flawed insights. It's that simple. To keep your data clean and your attribution clear, two things are absolutely critical.
First, you need consistent UTM parameters for every single campaign link you push live. UTMs are just simple tags you add to a URL, but they're your best friend for telling analytics tools exactly where your traffic came from. A disciplined UTM strategy is often the only thing separating clean, actionable reports from a chaotic mess of "direct/none" traffic that tells you nothing.
Second, you have to nail your conversion tracking on every platform. This means clearly defining what counts as a 'conversion'—be it a form fill, a PDF download, or a product purchase—and then making sure the tracking pixel or code is installed correctly everywhere. This isn't just a box to check; it's fundamental to measuring your marketing effectiveness and calculating ROI. Without it, you’re just guessing.
Analyzing Data to Understand the 'Why'
Collecting data is just the first step. The real magic happens when you start to understand the story that data is trying to tell you. Raw numbers can show you what happened—a spike in traffic, a dip in sales—but digging into the analysis reveals the why. This is where you connect the dots between your marketing efforts and real business results, uncovering the insights that will shape your strategy for months and years to come.
A great place to start this journey is with marketing attribution. Think of it as the art and science of giving credit where credit is due. When a customer makes a purchase, which marketing touchpoint gets the applause? Was it the first blog post they ever read? The email newsletter they opened last week? Or the retargeting ad they clicked just before buying? The answer completely depends on the attribution model you choose.
Picking the Right Attribution Model
Let's be clear: there's no single "best" attribution model. Each one offers a different lens through which to view the customer journey, and each has its own strengths and weaknesses. It's all about picking the right tool for the job.
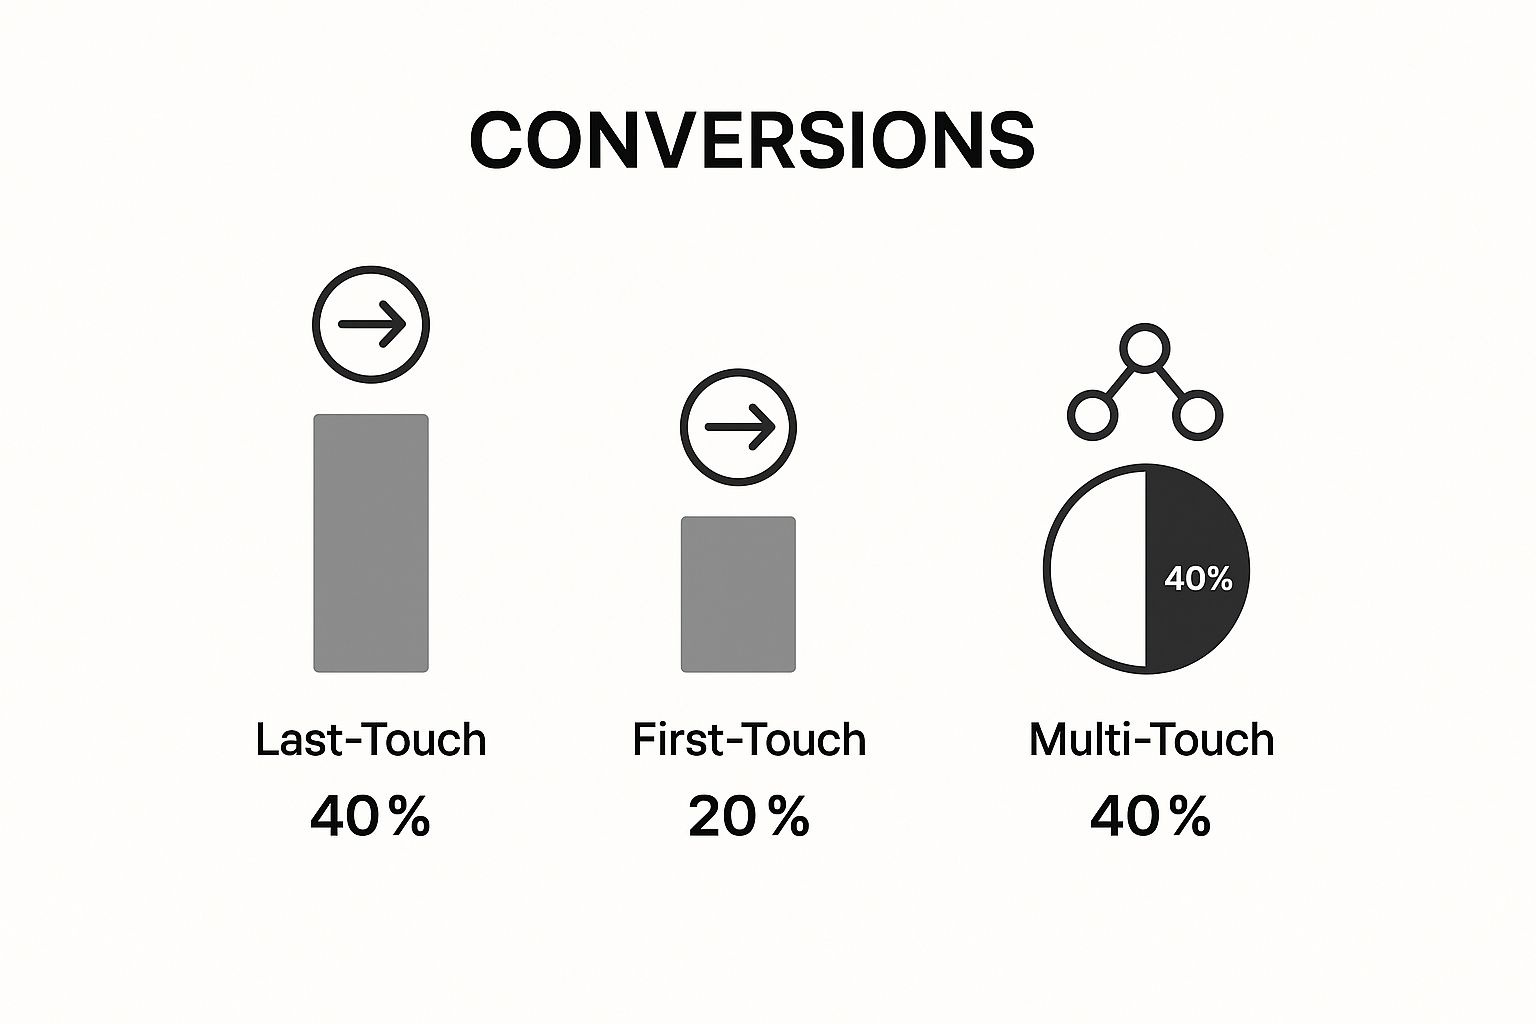
As you can see from the image, how you assign credit dramatically changes your perception of which channels are working. Relying on a single model can give you a skewed picture, leading you to make poor decisions—like cutting the budget for a channel that's actually crucial for introducing new customers to your brand.
To help you navigate this, let's break down the most common models you'll encounter.
Comparing Marketing Attribution Models
Choosing an attribution model is a strategic decision. Each model tells a different part of the customer's story. The table below compares the most common ones, highlighting their practical benefits and limitations to help you decide which perspective is most useful for your analysis.
| Attribution Model | How It Works | Primary Benefit | Key Limitation |
|---|---|---|---|
| First-Touch | Gives 100% of the credit to the very first interaction a customer has with your brand. | Great for understanding which channels excel at generating initial awareness and filling the top of your funnel. | Ignores the impact of all subsequent touchpoints that nurtured the lead and closed the sale. |
| Last-Touch | Assigns 100% of the credit to the final touchpoint right before the conversion. | Simple to implement and clearly shows which channels are most effective at sealing the deal. | Devalues all the earlier interactions that introduced and educated the customer, giving a narrow view of the journey. |
| Linear | Spreads credit evenly across every single touchpoint in the customer's journey. | Provides a balanced view and ensures no touchpoint is completely ignored. | Treats all interactions as equally important, which is rarely true. A blog post and a demo request have different impacts. |
| Time-Decay | Gives more credit to touchpoints that happened closer in time to the conversion. | Acknowledges that interactions closer to the sale are often more influential, offering a more realistic multi-touch view. | Can still undervalue critical, early-stage awareness channels that started the customer relationship long ago. |
Ultimately, the smartest approach is to look at your data through several of these models. Comparing a first-touch view against a last-touch view gives you a much richer narrative of how your channels work together to guide customers from discovery to decision.
Expert Tip: Don't get locked into a single attribution model. The goal isn't to find one "perfect" answer but to build a complete story. By comparing insights from a few different models, you get a 360-degree view of your marketing performance, preventing you from accidentally defunding a channel that’s quietly doing the heavy lifting at the top of the funnel.
Beyond Basic Attribution Models
While these standard models are a fantastic starting point, the world of marketing analytics has evolved. More advanced methods are becoming surprisingly accessible, offering a much deeper and more accurate understanding of your marketing's true impact.
Two major players are stepping into the spotlight here:
- Incrementality Testing: This method gets to the heart of a crucial question: "Would this conversion have happened anyway if we hadn't run this ad?" It helps you measure the true, causal lift from your campaigns.
- Media Mix Modeling (MMM): This isn't a new concept, but it's seeing a massive resurgence. In fact, 61% of marketers are planning to use MMM to improve their measurement, especially as privacy changes make other forms of tracking more difficult.
The best part? You no longer need a team of data scientists to get started. Open-source tools from major players, like Google's Meridian and Meta's Robyn, are making powerful MMM technology available to everyone. You can discover more about these marketing measurement trends on Adriel.com.
By layering these advanced techniques over your traditional attribution analysis, you can finally move beyond simple correlation ("this happened when we did that") to genuine causation ("this happened because we did that"). This is how you confidently prove marketing's value and make genuinely data-backed investment decisions.
Turning Insights Into Action and Proving Value

Let's be honest: data analysis is pointless if it just gathers dust in a spreadsheet. The real magic happens in this final, crucial phase—transforming those hard-won insights into real-world improvements and, just as importantly, proving your team's value to the rest of the company.
This isn't about creating a one-and-done report. It's about building a continuous cycle of learning, testing, and optimizing.
Your analysis will start to surface some compelling theories about what’s clicking with your audience and what's falling flat. For instance, you might dig into your CRM and discover that leads from webinar campaigns have a 25% higher close rate than those coming from paid search. That single insight is your signal to start asking bigger questions and taking action.
Validating Insights with A/B Testing
Before you go all-in and shift your entire budget based on one data point, you need to be sure. This is where disciplined A/B testing becomes your best friend. Think of it as applying the scientific method to marketing, letting you isolate variables and prove that what you think is happening actually is happening.
- Test Your Hypothesis: Set up a test to confirm that webinar theory. You could run a campaign that drives traffic to both a webinar registration page and a high-intent paid search landing page.
- Isolate the Variable: The key here is to make sure the channel or call-to-action is the only major difference. The offer, core messaging, and target audience should be as close to identical as possible.
- Measure the Outcome: Don't just track the initial conversion. Follow the entire journey. Track the lead quality and the final sales outcomes right inside your CRM.
This simple process turns a hunch into a proven fact. It gives you the confidence to make much bigger strategic moves, like dedicating more ad spend to webinar promotion, knowing it's backed by solid evidence.
Communicating Your Impact to Stakeholders
Creating value is only half the battle; you have to prove it, too. Your stakeholders, whether it's the CEO or the sales director, don't live in a world of "click-through rates." They speak the language of revenue, customer acquisition cost, and bottom-line growth. Your job is to be the translator.
The most effective marketing teams don’t just report on metrics; they build a compelling narrative around their performance. They connect a 5% increase in conversion rate to a tangible reduction in Customer Acquisition Cost and a direct contribution to the quarterly sales pipeline.
Build dashboards that tell a clear, visual story. Get away from just dumping raw numbers and focus on showing trends and explaining what they mean for the business. To make this even easier, you can explore options for automated report generation that deliver consistent, easy-to-digest updates without the manual-pulling headache.
Ultimately, the goal of measuring marketing effectiveness is about understanding and maximizing your return on investment—a concept expertly detailed when unlocking your franchise ROI. By consistently testing, optimizing, and translating your results into the language of business, you cement marketing’s role as a vital driver of growth and secure the budget and buy-in you need to keep winning.
Your Top Marketing Measurement Questions, Answered
Even with the best plan in place, putting marketing measurement into practice always brings up a few questions. I've been there. Let's walk through some of the most common ones I hear from teams to help you cut through the noise and focus on what matters.
Metric vs. KPI: What’s the Real Difference?
It’s easy to get these two mixed up, but the distinction is crucial.
Think of metrics as raw data points. They're just numbers—things like total website visitors, social media follower counts, or email subscribers. You can measure hundreds of them.
A Key Performance Indicator (KPI), on the other hand, is a metric you've specifically chosen because it directly reflects your progress toward a core business goal. If your objective is to get more qualified leads, a great KPI wouldn't just be "website traffic," but something more specific like "new demo requests from organic search."
All KPIs are metrics, but not all metrics are KPIs. The real skill is choosing the few vital metrics that tell you whether you're winning or losing.
How Often Should I Be Looking at My Analytics?
There’s no magic number here. The right frequency depends entirely on the metric itself and the natural pace of your business. Trying to apply a single schedule to all your data is a recipe for frustration.
Here’s a practical breakdown I use with my own teams:
- Daily or Weekly: This is for your fast-moving, operational metrics. Think ad spend, specific campaign conversions, website uptime, and email open rates. These are the canaries in the coal mine that can alert you to immediate problems or quick wins. For a deeper look, our guide on how to monitor website traffic is a great resource.
- Monthly: This is the perfect cadence for reviewing your more strategic KPIs. At the end of each month, you should be looking at the bigger picture: your overall Customer Acquisition Cost (CAC), which channels are performing best, and your marketing-to-sales lead conversion rates.
- Quarterly: Time to zoom out for a high-level strategic review. This is when you dig into long-term trends, question the accuracy of your attribution models, and make those big-budget decisions for the upcoming quarter.
What’s a Good Marketing ROI, Anyway?
This is the million-dollar question, and the honest answer is: it depends. There's no universal benchmark for a "good" Return on Investment (ROI) because it's so tied to your industry, business model, and profit margins.
A 5:1 ratio—meaning you generate $5 for every $1 spent—is often thrown around as a solid target.
But context is everything. A 3:1 ratio could be outstanding for a SaaS startup aggressively buying market share. Meanwhile, a well-oiled e-commerce store with high-margin products might consider a 10:1 ratio their standard. The goal isn't to hit a random number, but to figure out what's profitable for your business and then consistently work to improve it.
It's also worth noting that the definition of "return" is expanding. Many brands are now tracking their impact beyond just financials, looking at things like Social Return on Investment (SROI) or even Carbon Footprint Reduction to get a fuller picture of their marketing's value. You can learn more about these evolving marketing measurement trends and see where the industry is heading.
Ready to get a clear, unified view of your SEO performance? That's Rank puts all your critical data—from keyword rankings to competitor analysis—into one simple dashboard. Stop guessing and start making data-driven decisions that grow your organic traffic. https://www.thatisrank.com